

Centerra Gold Records $50.4 Million Net Earnings and Generates $118.8 Million Cash from Operations
This news release contains forward-looking information that is subject to the risk factors and assumptions set out under “Caution Regarding Forward-looking Information”. It should be read in conjunction with the Company’s unaudited interim condensed consolidated financial statements and the notes thereto for the three months ended March 31, 2019. The consolidated financial statements of Centerra Gold Inc. are prepared in accordance with International Financial Reporting Standards as issued by the International Accounting Standards Board. All figures are in United States dollars and all production figures are on a 100% basis, unless otherwise stated.
|
|||||||||||||||
All references in this document denoted with NG, indicate a non-GAAP term which is discussed under “Non-GAAP Measures” and reconciled to the most directly comparable GAAP measure.
TORONTO, May 01, 2019 (GLOBE NEWSWIRE) -- Centerra Gold Inc. (“Centerra”) (TSX: CG) today reported first quarter 2019 net earnings of $50.4 million or $0.17 per common share (basic) on revenues of $334.0 million. During the same period in 2018, the Company reported net earnings of $9.0 million or $0.03 per common share (basic) on revenues of $235.4 million. Adjusted earningsNG in the first quarter of 2019 were $50.4 million or $0.17 per common share (basic), compared to $13.4 million or $0.05 per common share (basic) in the first quarter of 2018, which excludes charges relating to the acquisition of AuRico Metals Inc.
2019 First Quarter Highlights
_____________________________________________________________________
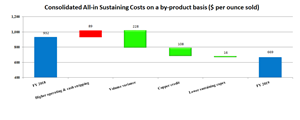
- Company-wide all-in sustaining costs per ounce soldNG was $669, including $553 at Kumtor and $842 at Mount Milligan.
- Produced 183,563 ounces of gold, which includes 150,308 ounces at Kumtor. Mount Milligan produced 33,255 ounces of gold and 11.4 million pounds of copper.
- Cash generated from operations totalled $118.8 million (including $120.0 million from Kumtor and $12.4 million from Mount Milligan).
- Construction at the Öksüt Project in Turkey is now approximately 49% complete.
- Mount Milligan received approvals to access to Philip Lake 1, Rainbow Creek and Meadows Creek until November 2021.
- Repaid net $21 million on the Company’s credit facilities.
- Cash, cash equivalents and restricted cash increased during the quarter by $ 28.7 million and at March 31, 2019 were $207.9 million.
- Re-affirmed 2019 Company-wide guidance, which now reflects Kumtor splitting cut-back 19 into two phases (East and West) and deferring access to cut-back 19 East to later years in the mine plan and additional capital stripping on cut-back 20 in 2019. See "Kumtor Operating Results - Kumtor Ground Movements".
- Kemess Underground Project received its amended air emissions permit on April 8, 2019.
Commentary
Scott Perry, President and Chief Executive Officer of Centerra stated, “We are very pleased to report that our Thompson Creek Mine achieved a significant milestone during the quarter in attaining five full years without a lost time injury. This is evident of our employees embracing our Work Safe – Home Safe program as we continue to drive to zero harm within the workplace.”
“The operations produced a total of 183,563 ounces of gold and 11.4 million pounds of copper in the quarter. Kumtor had a very strong quarter producing 150,308 ounces of gold which was attributable to higher grades and recoveries. At Mount Milligan, the mill processed 32,000 tonnes per operating day during the quarter as we continued to constrain mill throughput levels pending the onset of the spring melt season. This resulted in production of 33,255 ounces of gold and 11.4 million pounds of copper during the quarter. At Mount Milligan, with the receipt of the 3-year permits to access water from Philip Lake 1, Rainbow Creek and Meadows Creek, the necessary infrastructure was constructed to enable us to pump water as the spring melt commences. We expect mill throughput levels to be at full capacity (55,000 tonnes per day) starting mid-May as additional water is captured during the pending spring melt.”
“Company-wide our all-in sustaining costs (before taxes)NG were $669 per ounce for the quarter reflecting Kumtor achieving all-in sustaining costs (before taxes)NG of $553 per ounce.”
“Construction activity continued at the Öksüt Project in Turkey and is now approximately 49% complete overall. The project continues to be on time and on budget, and is on track for first gold pour in the first quarter of 2020.”
“Our Greenstone Joint Venture achieved a significant milestone in the quarter with the receipt of the provincial approval of its Environmental Assessment. We continue to advance and finalize the long-term relationship agreements with the local indigenous groups and work on permit applications.”
“Financially, the business delivered approximately $114 million of consolidated cash provided by operations before changes in working capitalNG in the quarter. Kumtor and Mount Milligan generated $110 million and $17 million respectively, before working capital changes. During the first quarter, Kumtor generated $92 million of free cash flowNG which enabled the Company to reduce its debt in the quarter by approximately $21 million net, ending the quarter with cash and cash equivalents of $180 million (excluding restricted cash).”
Exploration Update
Exploration activities in the first quarter of 2019 included drilling, surface sampling, geological mapping and geophysical surveying at the Company’s various projects. Exploration expenditures totalled $5.0 million compared to $2.4 million in the same quarter of 2018.
Kyrgyz Republic
Kumtor Mine
During the first quarter of 2019, exploration drilling programs continued with the completion of fifty-eight diamond drill holes for 17,052 metres, including 4,615 metres of infill drilling in the SB underground zone. Exploration drilling focused on testing zones of mineralization for additional open pit resources in the Central Pit Area, including the corridor between the Central and Southwest pits and the north-east side of the Central Pit, SW Area, and on the flanks of the Northeast target area.
Central Pit
In the Hockey Stick Zone, five drill holes for 1,422 metres were completed. The drilling results revealed intersections of gold mineralization. The best intercepts are as follows:
| D1848: | 11.9 metres @ 23.05 g/t Au from 232.0 metres Includes 3.0 metres @ 49.39 g/t Au from 232.9 metres; |
| D1852: | 33.5 metres @ 5.18 g/t Au from 269.2 metres Includes12.7 metres @ 10.6 g/t Au from 276.2 metres; |
| D1858: | 20.3 metres @ 5.04 g/t Au from 189.5 metres Includes 5.6 metres @ 11.14 g/t Au from 191.3 metres; 15.9 metres @ 2.02 g/t Au from 227.5 metres Includes 5.2 metres @ 4.59 g/t Au from 235.2 metres. |
Eleven drill holes were completed in the North Wall totaling 2,190 metres. Gold mineralization was intersected with the best intercepts being:
| D1844: | 11.6 metres @ 1.31 g/t Au from 49.6 metres; 7.4 metres @ 1.17 g/t Au from 273.4 metres; |
| D1851: | 15.0 metres @ 1.92 g/t Au from 104.0 metres Includes 5.0 metres @ 4.29 g/t Au from 109.0 metres; |
| D1860: | 8.1 metres @ 1.96 g/t Au from 25.1 metres; 20.8 metres @ 2.92 g/t Au from 143.5 metres; 5.0 metres @ 1.22 g/t Au from 170.2 metres; |
| D1866A: | 20.7 metres @ 5.29 g/t Au from 151.9 metres Includes 8.0 metres @ 11.08 g/t Au from 155.9 metres; |
| D1875: | 24.0 metres @ 1.85 g/t Au from 119.9 metres Includes 5.9 metres @ 5.81 g/t Au from 131.6 metres. |
In the SB Zone, underground infill drilling was carried out with the completion of fourteen drill holes for 4,615 metres. The best intercepts are as follows:
| D1828: | 67.2 metres @ 5.91 g/t Au from 297.0 metres Includes 4.0 metres @ 12.98 g/t Au from 303.0 metres Includes 3.7 metres @ 13.68 g/t Au from 326.9 metres Includes 10.8 metres @ 11.92 g/t Au from 334.6 metres; |
| D1850: | 29 metres @ 4.64 g/t Au from 337.0 metres Includes 12.3 metres @ 9.64 g/t Au from 348.0 metres; |
| D1855: | 14.6 metres @ 12.40 g/t Au from 118.3 metres Includes 6.0 metres @ 28.40 g/t Au from 123.5 metres; |
| D1868: | 68.0 metres @ 5.39 g/t Au from 241.5 metres Includes 9.8 metres @ 10.97 g/t Au from 246.0 metres Includes 3.6 metres @ 10.94 g/t Au from 290.0 metres; 11.0 metres @ 3.84 g/t Au from 316.5 metres; |
| D1874: | 104.8 metres @ 5.61 g/t Au from 36.7 metres Includes 37.9 metres @ 13.3 g/t Au from 36.7 metres; |
| D1876: | 11.3 metres @ 12.13 g/t Au from 59.2 metres; |
| D1878: | 6.2 metres @ 4.92 g/t Au from 12 metres; 41.1 metres @ 5.88 g/t Au from 36.2 metres Includes 8.0 metres @ 11.94 g/t Au from 47.3 metres Includes 5.0 metres @ 11.92 g/t Au from 64.3 metres; 13.0 metres @ 2.66 g/t Au from 85.5 metres; 22.8 metres @ 2.18 g/t Au from 135.8 metres; Includes 4.0 metres @ 5.12 g/t Au from 141.6 metres. |
Southwest Area
Twelve drill holes were completed between Southwest and Central Pits for a total of 3,054.7 metres. The best intercepts included:
| SW-19-275A: | 10.4 metres @ 1.64 g/t Au from 189.8 metres; |
| SW-19-276A: | 17.5 metres @ 2.08 g/t Au from 496.5 metres; 27.6 metres @ 2.23 g/t Au from 553.2 metres. |
Northeast Area
In Northeast area, eleven drill holes were completed for a total of 3,838.4 metres. The best intercepts are:
| DN1853: |
7.6 metres @ 6.52 g/t Au from 266.5 metres; 11.3 metres @ 2.42 g/t Au from 301 metres; |
| DN1859: | 11.6 metres @ 2.67 g/t Au from 312.5 metres; 33.6 metres @ 5.72 g/t Au from 330.8 metres; Includes 14.1 metres @ 11.97 g/t Au from 335.5 metres; |
| DN1879: | 16.8 metres @ 5.35 g/t Au from 282.5 metres; 10.3 metres @ 1.52 g/t Au from 316.5 metres. |
The above mineralized intercepts were calculated using a cut-off grade of 1.0 g/t Au, minimum interval of 4.0 m and a maximum internal dilution interval of 5.0 metres. Drill collar locations and associated graphics are available at the following link: http://ml.globenewswire.com/Resource/Download/837f5e4e-3a7e-45e7-9efb-cafe01af634f
A complete listing of the drill results, drill hole locations and plan map for the Kumtor Mine have been filed on the System for Electronic Document Analysis and Retrieval (‘SEDAR’) at www.sedar.com and are available at the Company’s web site www.centerragold.com.
Canada
Mount Milligan Mine
The 2019 near pit infill and expansion drilling program at Mount Milligan began in February. A total of 2,040 metres in six drill holes were completed in the Southern Star Zone during the first quarter of 2019. Selected best results from the first three drill holes are reported below.
Southern Star Zone
| 19-1128: 43.4 metres @ 0.28 g/t Au, 0.18% Cu from 244.0 metres; 19-1130: 15.0 metres @ 0.36 g/t Au, 0.15% Cu from 67.0 metres; |
|
| 19-1130: 96.0 metres @ 0.26 g/t Au, 0.15% Cu from 127.0 metres; 19-1130: 15.0 metres @ 0.49 g/t Au, 0.15% Cu from 252.0 metres. |
The program will continue to mid-September with approximately 22,500 metres of drilling in 60 drill holes planned in the Southern Star, Saddle, 66, Great Eastern Fault, MBX, and Oliver zones.
The above mineralized intercepts were calculated using a cut-off grade of 0.1 g/t Au and a maximum internal dilution interval of 4 metres. Drill collar locations and associated graphics are available at the following: http://ml.globenewswire.com/Resource/Download/837f5e4e-3a7e-45e7-9efb-cafe01af634f
A listing of the drill results, drill hole locations and plan map for the Mount Milligan Mine have been filed on the System for Electronic Document Analysis and Retrieval (‘SEDAR’) at www.sedar.com and are available at the Company’s web site www.centerragold.com.
Kemess Project
The 2019 Kemess exploration program started at the end of the first quarter and includes core relogging (28,000 metres) and diamond drilling (6,200 metres to begin in the second half of 2019). Conceptual exploration targeting continued with the identification of two targets proximal to the Kemess Underground deposit (KUG Shoulder and Footwall zones).
Turkey
Öksüt Gold Project
At the Öksüt Gold Project, planning for the 2019 diamond drilling program was completed in the first quarter. The drill program is expected to commence in the middle of the second quarter of 2019 with three drilling rigs for 47 drill holes totalling 11,000 metres.
During the first quarter of 2019, a 3D non-linear Induced Polarization (IP) geophysical survey, covering the Keltepe NW, Keltepe, Güneytepe and Yelibelen prospects, was completed. Preliminary results from the survey have been received and are undergoing compilation and assessment. The aim of the survey is to generate additional targets and confirm and/or refine deeper targets around the known deposits.
Greenfields Exploration
Other Projects
During the first quarter of 2019, exploration programs targeting gold and copper were ongoing in Turkey, Canada, Mexico, Sweden, Finland and Burkina Faso.
Qualified Person & QA/QC
All mineral reserve and mineral resource estimates and other scientific and technical information in this news release were prepared in accordance with the standards of the Canadian Institute of Mining, Metallurgy and Petroleum and National Instrument 43-101 – Standards of Disclosure for Mineral Projects (“NI 43-101”) and were prepared, reviewed, verified and compiled by Centerra’s geological and mining staff under the supervision of Gordon Reid, Professional Engineer and Centerra’s Vice-President and Chief Operating Officer, who is the qualified person for the purpose of NI 43-101. Sample preparation, analytical techniques, laboratories used and quality assurance-quality control protocols used during the drilling programs are consistent with industry standards and independent certified assay labs are used, with the exception of the Kumtor project as described in its technical report dated March 20, 2015.
Exploration information and other related scientific and technical information in this news release regarding the Kumtor Mine were prepared in accordance with the standards of National Instrument 43-101 (“NI 43-101”) and were prepared, reviewed, verified and compiled by Boris Kotlyar, a member with the American Institute of Professional Geologists (AIPG), Chief Geologist, Global Exploration with Centerra Gold Inc., who is the qualified person for the purpose of NI 43-101. Sample preparation, analytical techniques, laboratories used and quality assurance-quality control protocols used during the exploration drilling programs are done consistent with industry standards and independent certified assay labs are used. The Kumtor deposit is described in Centerra’s most recently filed Annual Information Form and a technical report dated March 20, 2015 (with an effective date of December 31, 2014), which are both filed on SEDAR at www.sedar.com.
Exploration information and other related scientific and technical information in this news release regarding the Mount Milligan Mine were prepared in accordance with the standards of NI 43-101 and were prepared, reviewed, verified and compiled by C. Paul Jago, Member of the Engineers and Geoscientists British Columbia, Exploration Manager at Centerra’s Mount Milligan Mine, who is the qualified person for the purpose of NI 43101. Sample preparation, analytical techniques, laboratories used and quality assurance-quality control protocols used during the exploration drilling programs are done consistent with industry standards and independent certified assay labs are used. The Mount Milligan deposit is described in Centerra’s most recently filed Annual Information Form and a technical report dated March 22, 2017 (with an effective date of December 31, 2016) prepared in accordance win NI 43-101, both of which are available on SEDAR at www.sedar.com.
Exploration information and other related scientific and technical information in this news release regarding the Öksüt Project were prepared, reviewed, verified and compiled in accordance with NI 43-101 by Mustafa Cihan, Member of the Australian Institute of Geoscientists (AIG), Exploration Manager Turkey at Centerra’s Turkish subsidiary Centerra Madencilik A.Ş., who is the qualified person for the purpose of NI 43-101. Sample preparation, analytical techniques, laboratories used and quality assurance-quality control protocols used during the exploration drilling programs are done consistent with industry standards and independent certified assay labs are used. The Öksüt deposit is described in Centerra’s most recently filed Annual Information Form and in a technical report dated September 3, 2015 (with an effective date of June 30, 2015) prepared in accordance with NI 43-101 both of which are available on SEDAR at www.sedar.com.
This Management Discussion and Analysis (“MD&A”) has been prepared as of April 30, 2019, and is intended to provide a review of the financial position and results of operations of Centerra Gold Inc. (“Centerra” or the “Company”) for the three months ended March 31, 2019 in comparison with the corresponding periods ended March 31, 2018. This discussion should be read in conjunction with the Company’s unaudited condensed consolidated interim financial statements and the notes thereto for the three months ended March 31, 2019 prepared in accordance with International Financial Reporting Standards (“IFRS”). This MD&A should also be read in conjunction with the Company’s audited annual consolidated financial statements for the years ended December 31, 2018 and 2017, the related MD&A and the Annual Information Form for the year ended December 31, 2018 (the “2018 Annual Information Form”). The Company’s unaudited condensed consolidated interim financial statements and the notes thereto for the three months ended March 31, 2019, 2018 Annual Report and 2018 Annual Information Form are available at www.centerragold.com and on the System for Electronic Document Analysis and Retrieval (“SEDAR”) at www.sedar.com. In addition, this discussion contains forward-looking information regarding Centerra’s business and operations. Such forward-looking statements involve risks, uncertainties and other factors that could cause actual results to differ materially from those expressed or implied by such forward looking statements. See “Risk Factors” and “Caution Regarding Forward-Looking Information” in this discussion. All dollar amounts are expressed in United States dollars (“USD”), except as otherwise indicated.
Overview
Centerra is a Canadian-based gold mining company primarily focused on operating, developing, exploring and acquiring gold and copper properties in North America, Asia and other markets worldwide. Centerra’s principal operations are the Kumtor Gold Mine located in the Kyrgyz Republic and the Mount Milligan Gold-Copper Mine located in British Columbia, Canada. The Company is currently constructing its next gold mine, the Öksüt Project in Turkey, has two development properties in Canada (one of which is held 50%), and properties or joint venture options over properties in Canada, Finland, Mexico, Turkey and the United States. The Company also has strategic alliance agreements with partners to evaluate potential opportunities in West Africa and Sweden.
The Company’s significant wholly-owned subsidiaries include Kumtor Gold Company (“KGC” or “Kumtor”) in the Kyrgyz Republic, Thompson Creek Metals Company Inc. (“Thompson Creek”) and AuRico Metals Inc. (“AuRico”) in Canada, Langeloth Metallurgical Company LLC (“Langeloth”) and Thompson Creek Mining Co. in the United States of America and Öksüt Madencilik Sanayi vi Ticaret A.S. (“OMAS”) in Turkey. Additionally, the Company holds, through Thompson Creek, a 75% joint venture interest in the Endako Mine in British Columbia, Canada. The Company also owns a 50% partnership interest in Greenstone Gold Mines LP (the “Greenstone Partnership”) which owns the Greenstone Gold development property including the Hardrock deposit, located in Ontario, Canada. See “Operating Mines and Facilities”, “Development Projects” and “Other Corporate Developments” for further details.
Centerra’s common shares are listed for trading on the Toronto Stock Exchange under the symbol CG. As of April 30, 2019, there are 292,529,974 common shares issued and outstanding and options to acquire 5,424,721 common shares outstanding under its stock option plan and 1,221,074 units outstanding under its restricted share unit plan.
Market Conditions
Gold Price
During the first quarter of 2019, the spot gold price fluctuated between a low of $1,279 per ounce and a high of $1,345 per ounce. The average spot gold price for the first quarter was $1,304 per ounce, a decrease of $25 per ounce from the first quarter of 2018 average ($1,329 per ounce), and a $75 per ounce increase compared to the fourth quarter of 2018 average ($1,229 per ounce).
Copper Price
The average spot copper price in the first quarter of 2019 was $2.82 per pound, a $0.33 per pound decrease compared to the first quarter of 2018 average of $3.15 per pound, and a $0.02 per pound increase compared to the fourth quarter of 2018 average ($2.80 per pound).
Molybdenum Price
The average molybdenum price in the first quarter of 2019 was $11.78 per pound, a $0.44 per pound decrease compared to the first quarter of 2018 average of $12.22 per pound, and a $0.27 per pound decrease compared to the fourth quarter of 2018 average ($12.05 per pound).
Foreign Exchange Rates
USD to CAD
The average U.S. dollar to Canadian dollar exchange rate for the first quarter of 2019 (1.33), weakened when compared to the average of the fourth quarter of 2018 (1.32), with rates in the first quarter ranging from 1.31 to 1.36. After starting at its lowest point for the quarter (1.36), the Canadian dollar strengthened to 1.33 by March 31, 2019.
USD to Kyrgyz Som
The average U.S. dollar to Kyrgyz som exchange rate for the first quarter of 2019 (69.8) was relatively consistent with the average of the first quarter of 2018 (69.6), with rates in the quarter ranging from 69.7 to 69.9.
USD to Turkish Lira
The average U.S. dollar to Turkish Lira exchange rate for the first quarter of 2019 was 5.4, relatively consistent with the fourth quarter of 2018 (5.5), but an increase of 42% when compared to the average of the first quarter of 2018 (3.8). The exchange rate ranged from 5.2 to 5.8 in the first quarter of 2019.
Foreign Exchange Transactions
The Company receives its revenues through the sale of gold, copper and molybdenum in U.S. dollars. The Company has operations in Canada, including its corporate head office, the Kyrgyz Republic, Turkey and the United States of America. During the first three months of 2019, the Company incurred combined expenditures (including capital) of approximately $261 million. Approximately $143 million of this (55%) was in currencies other than the U.S. dollar. Centerra’s non-U.S. dollar costs includes 65% in Canadian dollars, 28% in Kyrgyz Soms, 2% in Turkish lira, and 4% in Euros. During the quarter the Canadian dollar strengthened against the U.S. dollar on average 2.5% from its value at December 31, 2018. The Euro and the Turkish lira depreciated against the U.S. dollar by approximately 1% and 1.5%, respectively, over the same period. The net impact of these movements in the three months ended March 31, 2019 was to increase costs in the period by $2.3 million (decrease of $0.1 million in the three months ended March 31, 2018).
| Consolidated Financial and Operational Highlights | ||||||
| Unaudited ($ millions, except as noted) | Three months ended March 31, | |||||
| Financial Highlights | 2019 | 2018 | % Change | |||
| Revenue | $ | 334.0 | $ | 235.4 | 42% | |
| Cost of sales | 223.3 | 152.8 | 46% | |||
| Earnings from mine operations | 107.8 | 68.9 | 56% | |||
| Net earnings | $ | 50.4 | $ | 9.0 | 460% | |
| Adjusted earnings (3) | $ | 50.4 | $ | 13.4 | 276% | |
| Cash provided by (used in) operations | 118.8 | (39.7 | ) | 399% | ||
| Cash provided by operations, before changes in working capital (3) | 114.3 | 66.6 | 71% | |||
| Capital expenditures (sustaining) (3) | 19.8 | 24.7 | (20%) | |||
| Capital expenditures (growth and development projects) (3) | 25.5 | 10.8 | 136% | |||
| Capital expenditures (stripping) | 22.9 | 38.5 | (41%) | |||
| Total assets | $ | 2,889.3 | $ | 2,862.9 | 1% | |
| Long-term debt and lease obligation | 156.8 | 313.4 | (50%) | |||
| Cash, cash equivalents and restricted cash | 207.9 | 123.4 | 68% | |||
| Per Share Data | ||||||
| Net earnings per common share - $ basic (1) | $ | 0.17 | $ | 0.03 | 467% | |
| Net earnings per common share - $ diluted (1) | $ | 0.17 | $ | 0.03 | 467% | |
| Adjusted earnings per common share - $ basic (1)(3) | $ | 0.17 | $ | 0.05 | 240% | |
| Adjusted earnings per common share - $ diluted (1)(3) | $ | 0.17 | $ | 0.05 | 240% | |
| Per Ounce Data (except as noted) | ||||||
| Average gold spot price - $/oz(2) | 1,304 | 1,329 | (2%) | |||
| Average copper spot price - $/lbs(2) | 2.82 | 3.15 | (10%) | |||
| Average realized gold price (Kumtor) - $/oz(3) | 1,297 | 1,309 | (1%) | |||
| Average realized gold price (Mount Milligan - combined) - $/oz(3) (4) | 1,003 | 1,037 | (3%) | |||
| Average realized gold price (consolidated) - $/oz(3) | 1,229 | 1,277 | (4%) | |||
| Average realized copper price (consolidated) - $/lbs(3) | 2.49 | 2.22 | 12% | |||
| Operating Highlights | ||||||
| Gold produced – ounces | 183,563 | 129,764 | 41% | |||
| Gold sold – ounces | 196,451 | 132,432 | 48% | |||
| Payable Copper Produced (000's lbs) | 11,440 | 6,143 | 86% | |||
| Copper Sales (000's payable lbs) | 12,522 | 4,506 | 178% | |||
| Operating costs (on a sales basis) (3) | 168.9 | 111.5 | 51% | |||
| Unit Costs | ||||||
| Adjusted operating costs on a by-product basis - $/oz sold(3)(5) | $ | 423 | $ | 446 | (5%) | |
| Gold - All-in sustaining costs on a by-product basis – $/oz sold(3)(5) | $ | 669 | $ | 932 | (28%) | |
| Gold - All-in sustaining costs on a by-product basis (including taxes) – $/oz sold(3) (5) | $ | 813 | $ | 1,097 | (26%) | |
| Gold - All-in sustaining costs on a co-product basis (before taxes) – $/oz sold(3)(5) | $ | 696 | $ | 903 | (23%) | |
| Copper - All-in sustaining costs on a co-product basis (before taxes) – $/pound sold(3)(5) | $ | 2.06 | $ | 3.08 | (33%) | |
| (1) | As at March 31, 2019, the Company had 292,464,324 common shares issued and outstanding (292,529,974 common shares as of April 30, 2019). As of April 30, 2019, Centerra had 5,424,721 share options outstanding under its share option plan with exercise prices ranging from US$2.83 per share to Cdn$22.28 per share, with expiry dates between 2019 and 2027 and 1,221,074 units outstanding under its restricted share unit plan. | |
| (2) | Average for the period as reported by the London Bullion Market Association (US dollar Gold P.M. Fix Rate) and London Metal Exchange (LME). This is a non-GAAP measure and is discussed under “Non-GAAP Measures”. | |
| (3) | Non-GAAP measure. See discussion under “Non-GAAP Measures”. | |
| (4) | Combines streamed and unstreamed amounts. | |
| (5) | Excludes Molybdenum business. |
Overview of Consolidated Results
First quarter ended 2019 compared to First Quarter 2018
The Company recorded net earnings of $50.4 million in the first quarter of 2019, compared to $9.0 million in the same period of 2018. The higher earnings in the first quarter of 2019 reflect increased production and sale of gold and copper at Mount Milligan as throughput was 41% higher than in the comparative quarter at 2.4 million tonnes processed versus 1.7 million tonnes processed, while still constrained due to water availability. The mill operated at reduced levels throughout the first quarter of 2019 while, in 2018, the mill was shutdown for a significant portion of the first quarter and operated at partial capacity for the remainder of the quarter. At Kumtor, higher production and sales in the first quarter of 2019 were the result of processing ore with higher grades and recovery. Kumtor’s production and sales in the comparative quarter last year were negatively impacted from processing Sarytor ore with lower average mill head gold grades and lower recoveries. In addition, Centerra’s first quarter of 2018 earnings included costs related to the AuRico acquisition and integration costs of $4.4 million. Excluding the costs related to the AuRico acquisition, adjusted earningsNG in the first quarter of 2018 were $13.4 million.
Production:
Gold production for the first quarter of 2019 was 183,563 ounces compared to 129,764 ounces for the same period of 2018. Gold production at Kumtor was 150,308 ounces in the first quarter of 2019, 50% higher than the 100,220 ounces produced in the same period of 2018. The increase in ounces poured at Kumtor is a result of milling higher grade ore from stockpiles (3.73 g/t compared to 2.58 g/t) compared to 2018. During the quarter ended March 31, 2019, Mount Milligan produced 33,255 ounces of gold and 11.4 million pounds of copper, 13% and 86% higher than in the same period of 2018 respectively, due to higher mill throughput.
Safety and Environment:
Centerra had two reportable injuries, representing two medical aid injuries, in the first quarter of 2019. On March 23, 2019, the Thompson Creek Mine attained five full years without a lost time injury.
There were no reportable releases to the environment in the first quarter of 2019.
Financial Performance:
Revenue increased to $334.0 million in the first quarter of 2019 from $235.4 million in the first quarter of 2018, as a result of 48% more gold ounces sold (196,451 ounces compared to 132,432 ounces), 178% more copper pounds sold (12.5 million pounds compared to 4.5 million pounds) and higher average prices for copper and higher molybdenum sales (price and pounds sold) as compared to 2018, partially offset by 3% lower average sale prices for gold.
Cost of sales increased in the first quarter of 2019 to $223.3 million compared to $152.8 million in the same period of 2018, mainly resulting from higher sales volumes for all metals. Depreciation, depletion and amortization associated with production was $54.4 million in the first quarter of 2019 as compared to $41.3 million in the same period of 2018.
Standby costs of $10.8 million were recorded in the first quarter of 2018 representing overhead costs at Mount Milligan during the temporary mill shutdown and subsequent ramp-up period that were unrelated to normal processing volumes.
Corporate administration costs were $9.7 million in the first quarter of 2019, a decrease of $0.7 million compared to the same period of 2018, mainly due to costs related to the acquisition of AuRico Metals Inc. in the first quarter of 2018.
The Company recorded an income tax recovery of $2.1 million in the first quarter of 2019, mainly as a result of deferred tax recoveries relating to the Kemess operation. Income tax expense of $0.2 million, representing British Columbia Mineral Tax expense for Mount Milligan, was recorded in the same period of 2018.
Operating Costs:
Operating costs (on a sales basis)NG increased to $168.9 million in the first quarter of 2019 compared to $111.5 million in the same period of 2018, which includes an increase in operating costs of $12.2 million in the molybdenum business, mainly as a result of increased volumes and prices.
Centerra’s all-in sustaining costs on a by-product basis per ounce of gold soldNG, which excludes revenue-based tax and income tax, decreased to $669 in the first quarter of 2019 from $932 in the comparative period mainly as a result of more gold ounces sold, higher copper sales at Mount Milligan, lower capitalized stripping at Kumtor, lower sustaining capitalNG and lower administration costs in the first quarter of 2019 as compared to the first quarter of 2018.
A photo accompanying this announcement is available at http://www.globenewswire.com/NewsRoom/AttachmentNg/c32bddc2-59d5-42bf-be8b-81cbdd257fe3
| Cash generation and capital management: | ||||||
| Cashflow | ||||||
| Unaudited ($ millions, except as noted) | Three Months ended March 31, | |||||
| 2019 | 2018 | % Change | ||||
| Cash provided by operations before changes in working capitalNG | 114.3 | 66.6 | 72% | |||
| - Changes in working capital | 4.5 | (106.3 | ) | (104%) | ||
| Cash provided by (used in) operating activities | 118.8 | (39.7 | ) | (399%) | ||
| Cash used in investing activities: | ||||||
| - Capital additions (cash) | (61.8 | ) | (62.0 | ) | (0%) | |
| - Acquisition of AuRico Metals Inc., net of cash acquired | - | (226.8 | ) | (100%) | ||
| - Increase in restricted cash | - | (2.3 | ) | (100%) | ||
| - Other investing items | (4.7 | ) | (3.0 | ) | 56% | |
| Cash used in investing activities | (66.5 | ) | (294.1 | ) | (77%) | |
| Cash (used in) provided by financing activities: | ||||||
| - Net drawdown (repayment) of debt | (21.2 | ) | 49.1 | (143%) | ||
| - Proceeds from equity issuances (net) | 1.9 | - | - | |||
| - Lease payments | (1.4 | ) | - | - | ||
| - Payment of interest and borrowing costs | (2.9 | ) | (10.7 | ) | 72% | |
| Cash (used in) provided by financing activities | (23.6 | ) | 38.4 | (161%) | ||
| Increase (decrease) in cash and cash equivalents | 28.7 | (295.4 | ) | (110%) | ||
Cash provided by operations increased to $118.8 million in the first quarter of 2019, compared to $39.7 million used in the comparative period, as a result of higher operating earnings and lower movements in working capital in the current quarter. Comparing the first quarter of 2019 with the same period of 2018, Kumtor generated $120.0 million compared to $43.1 million, while Mount Milligan generated $12.4 million compared to a use of $42.4 million. The increases related mainly to higher production at both operations. Working capital movements were lower in the first quarter of 2019 due to the timing of shipments and payments.
Cash used in investing activities totalled $66.5 million in the first quarter of 2019 as compared to $294.1 million in the same period of 2018, which included $226.8 million to acquire AuRico Metals Inc.
Cash used in financing activities of $23.6 million in the first quarter of 2019 represents the net repayment of $21.2 million under the Corporate Facility (defined below) and payment of interest and borrowing costs. The Company borrowed $49.1 million on its credit facilities and paid interest and borrowing costs of $10.7 million in the first quarter of 2018.
Cash, cash equivalents, restricted cash and short-term investments at March 31, 2019 totalled $207.9 million, as compared to $179.2 million at December 31, 2018. The higher cash holdings in 2019 is primarily from significant cash receipts from sales in late March 2019 from both operations.
Credit Facilities:
Centerra was in compliance with the terms of all of its credit facilities as at March 31, 2019 and throughout the first quarter.
Centerra Revolving Term Corporate Facility
In 2018, the Company entered into a $500 million four-year senior secured revolving credit facility (the "Corporate Facility"). The Corporate Facility is for general corporate purposes, including working capital, investments, acquisitions and capital expenditures. Funds drawn under the Corporate Facility are available to be re-drawn on a quarterly basis, at the Company’s discretion, and repayment of the loaned funds may be extended until February 2022.
As at March 31, 2019, the Corporate Facility had a drawn balance of $70 million, reflecting a $41 million repayment in the first quarter from the $111 million balance at December 31, 2018.
OMAS Facility
OMAS, a wholly-owned subsidiary of the Company that owns the Öksüt Project, has a $150 million five-year credit facility (the “OMAS Facility”) with European Bank for Reconstruction and Development and UniCredit Bank AG. The purpose of the OMAS Facility is to assist in financing the construction of the Company’s Öksüt Project. As a condition of the OMAS Facility, the Company placed $25 million in restricted accounts with the lenders, including $15 million which is restricted until the Öksüt Project mining lease has been extended and $10 million which is restricted during the construction phase.
As part of an amendment to the OMAS Facility in 2018, OMAS agreed to apply all of its excess cash flow towards debt prepayment under the OMAS Facility until the Öksüt Project’s mining license is extended beyond its current expiry date of January 16, 2023. OMAS intends to apply for an extension of its mining license as soon as permitted under Turkish legislation, which is two years prior to expiry of the mining license. In addition, Centerra provided a limited guarantee of a portion of OMAS’ obligations under the OMAS Facility and will agree to comply with certain covenants which are consistent with the covenants under the Corporate Facility. The lenders under the OMAS Facility may call on Centerra’s guarantee if the Öksüt mining license is not extended beyond January 16, 2023.
The OMAS Facility expires on March 31, 2024 and as at March 31, 2019, had a drawn balance of $74.5 million. As at March 31, 2019, $6.3 million (December 31, 2018 - $6.2 million) of deferred financing fees are being amortized over the term of the OMAS Facility.
Caterpillar Financial Services Limited Promissory Note (“CAT Note”)
In 2016, as part of the Thompson Creek Metals Company Inc. (“TCM”) acquisition, the Company assumed TCM’s capital equipment lease obligations owed to Caterpillar Financial Services Limited (“Caterpillar”). The Company re-financed the leases in 2017, whereby the Company purchased the assets held under the finance leases through a loan payable to Caterpillar. The CAT Note is secured by assets previously held under the finance leases and contains certain non-financial covenants.
In late 2018, the term of the CAT Note was extended until March 25, 2020. An initial principal repayment of $5 million was made on January 25, 2019, at which time the interest rate reset to LIBOR + 3.50% (previously LIBOR + 4.93%).
As at March 31, 2019 the principal amount outstanding under the CAT Note was $27 million.
| Capital Expenditures | ||||
| Capital Expenditure (spent and accrued) | ||||
| $ millions | Three Months ended March 31, | |||
| 2019 | 2018 | Change | ||
| Consolidated: | ||||
| Sustaining capitalNG | 19.8 | 24.7 | (20%) | |
| Capitalized stripping (1) | 22.9 | 38.5 | (41%) | |
| Growth capitalNG | 2.0 | 3.4 | (41%) | |
| Öksüt Project development | 15.3 | 5.4 | 183% | |
| Greenstone Gold Property capital (2) | 3.6 | 1.8 | 100% | |
| Kemess Underground Project development | 4.6 | 0.2 | n/a | |
| Total (3) | 68.2 | 74.0 | (8%) | |
| (1) | Includes cash component of $17.4 million in the first quarter ended March 31, 2019 (2018: $28.7 million). | |||
| (2) | In accordance with the Company's accounting policy, the 50% share paid on behalf of Premier Gold Mines Limited in the project is capitalized as part of mineral properties in Property, Plant & Equipment. | |||
| (3) | Excludes capitalized equipment leases. | |||
Capital expenditures in the first quarter of 2019 totalled $68.2 million compared to $74.0 million in the same period of 2018, resulting mainly from reduced spending on capitalized stripping at Kumtor ($15.6 million) and lower sustaining capitalNG for equipment rebuilds and overhauls ($4.9 million), partially offset by higher spending on the Company’s development projects (mainly at Öksüt ($9.9 million), Kemess ($4.4 million) and Greenstone ($1.8 million)).
Financial Instruments
The Company seeks to manage its exposure to fluctuations in diesel fuel prices, commodity prices and foreign exchange rates by entering into derivative financial instruments from time-to-time.
Fuel Hedges:
The Company has a diesel fuel price hedging strategy using derivative instruments to manage the risk associated with changes in diesel fuel prices to the cost of operations at the Kumtor Mine. The Company currently hedges its exposure with crude oil futures contracts, as the price of diesel fuel closely correlates to the price of crude oil.
Mount Milligan Gold and Copper Facility Hedges:
In 2017, the Company entered in a gold and copper hedge program as a condition precedent to draw on a previous version of the Corporate Facility. As part of the amendment of the Corporate Facility in 2018, the hedging program is no longer required. The Company is allowing the remaining open hedges to unwind through the second quarter of 2019.
Gold and Copper Derivative Contracts:
The Company must satisfy its obligation under the Mount Milligan Streaming Arrangement (defined below) by delivering refined physical gold and London Metal Exchange (“LME”) copper warrants to Royal Gold at the time of receiving payment from third-party purchasers who purchase concentrate from the Mount Milligan Mine. In order to hedge the metal price risk that arises when physical purchase and concentrate sales pricing periods do not match, the Company has entered into certain forward gold and copper purchases and forward sales contracts pursuant to which it purchases gold or copper at an average price during a future quotational period and sells gold or copper at the current spot price. These derivative contracts are not designated as hedging instruments.
Foreign Exchange Hedges
The Company has significant exposure to the Canadian dollar as a result of its operations (Mt. Milligan) and its development projects (Kemess and Greenstone), in addition to the location of the Company’s corporate office. In order to mitigate this exposure, the Company enters into zero-cost collar instruments on a rolling basis with the intent of protecting the Company’s Canadian dollar exchange rate risk. These derivative contracts are not designated as hedging instruments for the purpose of hedge accounting.
The hedge positions for each of these programs as at March 31, 2019 are summarized as follows:
| As at March 31, 2019 | |||||||||
| Program | Instrument | Unit | Average strike price |
Type |
Settlement 2019 |
Fair value gain (loss) ('000') |
|||
| Fuel Hedges | Crude oil options(1) | Barrels | $63 | Fixed | 18,000 | $120 | |||
| Fuel Hedges | Zero-cost collars(2) | Barrels | $59/$70 | Fixed | 177,000 | $180 | |||
| Centerra Corporate Facility Hedging Program: | |||||||||
| Copper Hedges | Zero-cost collars(2) | Pounds | $2.50/$3.29 | Fixed | 7.3 million | ($25) | |||
| Gold Hedges | Zero-cost collars(2) | Ounces | $1,250/$1,372 | Fixed | 18,402 | ($7) | |||
| Gold/Copper Hedges (Royal Gold deliverables): | |||||||||
| Gold Derivative Contracts | Forward contracts(3) | Ounces | (4) | Float | 21,945 | ($95) | |||
| Copper Derivative Contracts | Forward contracts(3) | Pounds | (4) | Float | 2.5 million | $218 | |||
| FX Hedges | |||||||||
| USD/CAD Derivative Contracts | Zero-cost collars(2) | CAD Dollars | 1.30/1.36 | Fixed | 55.5 million | $15 | |||
| (1) | Under crude oil options, the Company can buy fuel contracts at a specified price at a certain future date. | |
| (2) | Under the zero-cost collar: (i) the Company can put the number of gold ounces or copper pounds or Canadian dollars to the counterparty at the minimum price, if the price were to fall below the minimum, and (ii) the counterparty has the option to require the Company to sell to it the number of gold ounces or copper pounds or Canadian dollars at the maximum price, if the price were to rise above the maximum. | |
| (3) | Under the Royal Gold forward contracts, the Company must sell specified quantities of gold or copper, at a specified contract price at a future date. | |
| (4) | Royal Gold hedging program with a market price determined on closing of the contract. |
Centerra does not enter into off-balance sheet arrangements with special purpose entities in the normal course of its business, nor does it have any unconsolidated affiliates.
Operating Mines and Facilities
Kumtor Mine
The Kumtor open pit mine, located in the Kyrgyz Republic, is one of the largest gold mines in Central Asia. It has been in production since 1997 and has produced over 12.2 million ounces of gold to March 31, 2019.
Developments in 2019
- In the first quarter of 2019, Kumtor produced 150,308 ounces of gold at an all-in sustaining cost of $553 per ounce sold.
- Kumtor successfully managed shifting ground conditions in the vicinity of the mill building and cut-back 19 during the first quarter of 2019.
- The Company continued to work with the Government of the Kyrgyz Republic to satisfy the conditions precedent to completion of the comprehensive settlement agreement entered into with the Government on September 11, 2017. The longstop date for satisfaction of all such conditions was extended a number of times by agreement of all parties and is now May 31, 2019. See “Other Corporate Developments – Kyrgyz Republic”.
| Kumtor Operating Results | |||||||
| ($ millions, except as noted) | Three months ended March 31, | ||||||
| 2019 | 2018 | % Change | |||||
| Financial Highlights: | |||||||
| Revenue - $ millions | 195.0 | 153.0 | 27% | ||||
| Cost of sales (cash) | 51.2 | 42.6 | 20% | ||||
| Cost of sales (non-cash) | 41.0 | 35.6 | 15% | ||||
| Cost of sales (total) | 92.2 | 78.2 | 18% | ||||
| Cost of sales - $/oz sold (1) | 613 | 669 | (8%) | ||||
| Cash provided by operations | 120.0 | 43.1 | 178% | ||||
| Cash provided by operations, before changes in working capital(1) | 109.9 | 84.6 | 30% | ||||
| Operating Highlights: | |||||||
| Tonnes mined - 000s | 49,194 | 47,314 | 4% | ||||
| Tonnes ore mined – 000s | 1,877 | 1,405 | 34% | ||||
| Average mining grade - g/t | 2.14 | 2.02 | 6% | ||||
| Tonnes milled - 000s | 1,575 | 1,668 | (6%) | ||||
| Average mill head grade - g/t | 3.73 | 2.58 | 44% | ||||
| Mill Recovery - % | 82.0 | % | 72.2 | % | 14% | ||
| Mining costs - total ($/t mined material) | 1.04 | 1.08 | (4%) | ||||
| Milling costs ($/t milled material) | 10.93 | 9.26 | 18% | ||||
| Gold produced – ounces | 150,308 | 100,220 | 50% | ||||
| Gold sold – ounces | 150,267 | 116,919 | 29% | ||||
| Average realized gold price (1) - $/oz sold | $ | 1,297 | $ | 1,309 | (1%) | ||
| Capital Expenditures (sustaining) (1) - cash | 8.9 | 11.3 | (21%) | ||||
| Capital Expenditures (growth) (1) - cash | 2.0 | 3.4 | (41%) | ||||
| Capital Expenditures (stripping) - cash | 17.4 | 28.7 | (39%) | ||||
| Capital Expenditures (stripping) - non-cash | 5.5 | 9.7 | (43%) | ||||
| Capital expenditures (total) | 33.8 | 53.2 | (36%) | ||||
| Operating Costs (on a sales basis)(2) | 51.2 | 42.6 | 20% | ||||
| Adjusted operating costs (1)- $/oz sold | $ | 375 | $ | 413 | (9%) | ||
| Operating Costs (on a sales basis)- $/oz sold(1) | $ | 340 | $ | 365 | (7%) | ||
| Gold - All-in sustaining costs on a by-product basis - $/oz sold(1) | $ | 553 | $ | 758 | (27%) | ||
| Gold - All-in sustaining costs on a by-product basis (including taxes) - $/oz sold(1) | $ | 735 | $ | 942 | (22%) | ||
(1) Non-GAAP measure. See discussion under “Non-GAAP Measures”
(2) Operating costs (on a sales basis) is a non-GAAP measure and is comprised of mine operating costs such as mining, processing, administration, royalties and production taxes (except at Kumtor where revenue-based taxes are excluded), but excludes reclamation costs and depreciation, depletion and amortization.
Production:
During the first quarter of 2019, Kumtor continued development activities in the Central Pit through mining cut-backs 19, 20A and unloading of ice. Advanced work on cut-back 20 pre-strip activities were carried out.
Total waste and ore mined in the first quarter of 2019 was 49.2 million tonnes compared to 47.3 million tonnes in the first quarter of 2018, representing an increase in production of 4%. This was mainly due to shorter cycle times and higher haul trucks utilization.
Kumtor produced 150,308 ounces of gold in the first quarter of 2019 compared to 100,220 ounces of gold in the same period of 2018. The increase in ounces poured in the first quarter of 2019 is primarily due to processing ore with higher grade and higher recovery from cut-back 18 stockpiles mined in 2018, compared to the processing of ore with lower grade and lower recovery that was stockpiled from cut-back 17 and from Sarytor in the first quarter of 2018. During the first quarter of 2019, Kumtor’s average mill head grade was 3.73 g/t with a recovery of 82.0% compared to 2.58 g/t and a recovery of 72.2% in the same period of 2018.
Operating costs and All-in Measures:
Operating costs (on a sales basis)NG, including capitalized stripping, decreased in the first quarter of 2019 by $2.8 million to $68.5 million compared to $71.3 million in the first quarter of 2018. The movements in the major components of operating costs (mining, milling and site support), including capitalized stripping but before changes in inventory, is explained below:
Mining costs, including capitalized stripping, totaled $51.3 million in the first quarter of 2019, which was slightly higher ($0.4 million) than the comparative quarter in 2018.
Milling costs amounted to $17.2 million in the first quarter of 2019 compared to $15.5 million in the comparative quarter of 2018. The increase is mainly from higher carbon fines processing costs ($0.9 million) as such operations were ramping up in the first quarter of 2018, higher grinding balls costs ($0.6 million) due to the processing of harder ore type and higher carbon costs ($0.3 million) mainly due to higher prices and consumption rate resulting from ore recovery optimization.
Site support costs in the first quarter of 2019 totaled $11.8 million compared to $12.9 million in 2018. The decrease is attributable primarily due to lower costs for camp supplies ($0.4 million) due to lower consumption, lower contractors’ costs ($0.4 million) due to fewer contractors and lower national labour costs mainly due to favourable exchange rate (69.8 som/$ vs. 68.5 som/$).
Other Cost movements:
Depreciation, depletion and amortization (“DD&A”) associated with sales increased to $41.0 million in the first quarter of 2019 from $35.6 million in the comparative period, mainly due to higher ounces sold and higher amortization of capitalized stripping resulting from the release of high-grade ore from cut-back 19.
All-in sustaining costs on a by-product basis per ounce soldNG, which excludes revenue-based tax, was $553 in the first quarter of 2019 compared to $758 in the same period of 2018. The decrease was mainly due to higher ounces sold and lower capitalized stripping as a result of accessing the main ore body in cut-back 19 in the first quarter of 2019 and, as a result, ceasing the capitalization of stripping activities.
Including revenue-based taxes, all-in sustaining costs on a by-product basis per ounce soldNG was $735 in the first quarter of 2019 compared to $942 in the comparative year. The decrease was mainly due to lower all-in sustaining costsNG (explained above), partially offset by higher revenue-based taxes resulting from increased sales revenue achieved in the first quarter of 2019.
Kumtor Ground Movements
The Company has successfully managed shifting ground conditions at Kumtor during the entire history of the mine. During the first quarter of 2019, Kumtor carried out mining activities in cut-back 19, in the vicinity of the mill building. Due to movement in the ground, some cracking in the concrete foundation of the mill building was identified. There was no impact observed in the grinding circuit and mill operations were not affected. The Company took a number of actions to stabilize the concrete mill foundations and mitigate further effects of the ground movement, including shifting mining activities away from the immediate area, relocating the boiler room (where the most significant cracking was observed) and implementing further de-watering activities.
As a result, movement of the mill foundations has ceased and remains stable. The mill continues to operate at full production and Kumtor maintains its 2019 production and cost guidance. Together with the assistance of external experts, Kumtor continues to review the ground conditions in the vicinity of the mill to ensure the safety and stability of the mill foundations and to determine what, if any, additional measures are necessary.
The Company does not expect any material effect on Kumtor’s future production or reserves and resources as a result of such ground movements.
Mount Milligan Mine
The Mount Milligan Mine is an open pit mine located in north central British Columbia, Canada producing a gold and copper concentrate. Production at Mount Milligan is subject to a streaming arrangement (the “Mount Milligan Streaming Arrangement”) with Royal Gold, Inc. and RGLD GOLD AG (collectively, “Royal Gold”) pursuant to which Royal Gold is entitled to purchase 35% of the gold produced and 18.75% of the copper production at the Mount Milligan mine for $435 per ounce of gold delivered and 15% of the spot price per metric tonne of copper delivered.
Water Update
As previously disclosed, starting in the fourth quarter of 2018, Mount Milligan reduced its milling throughput to properly manage its water balance during the winter season. The limited milling production continued through the first quarter of 2019. On February 23, 2019, the Company announced that the British Columbia Environmental Assessment Office (“EAO”) approved an amendment to Mount Milligan’s environmental assessment certificate to permit access to additional sources of surface water and groundwater. The Company is now permitted to obtain water for use in Mount Milligan’s milling operation from Philip Lake 1, Rainbow Creek and Meadows Creek until November 30, 2021 at set rates as well as water from groundwater sources within a radius of six kilometres of the Mount Milligan Mine for the life of the mine. Mount Milligan has upgraded its water pumping infrastructure and commenced access to water from the newly permitted sources at the beginning of April 2019. As a result, Mount Milligan slowly increased Mount Milligan’s mill processing throughput as water levels increased in the mill’s tailings storage facility. The Company expects that the additional water captured during the spring melt will be sufficient to allow Mount Milligan to return mill processing operations to full capacity (55,000 tonnes per day) starting mid-May and that Mount Milligan’s mill throughput will average approximately 55,000 tonnes per day through the remainder of 2019.
With respect to the updated long-term water supply plan, the Company continues to work with relevant stakeholders to identify and evaluate water sources that will best be able to supply Mount Milligan’s mill for the life-of-mine while meeting environmental and other parameters. Formal applications and government review is expected to commence later this year, and will be the subject of discussion with regulators, potentially affected Indigenous groups, local communities and other interested parties. The Company’s expectation is that its updated long-term water source (or sources) should be available after November 2021 for the entire life-of-mine. See “Caution Regarding Forward-Looking Information”.
| Mount Milligan Operating Results | ||||||||
| ($ millions, except as noted) | Three months ended March 31, | |||||||
| 2019 | 2018 | % Change | ||||||
| Financial Highlights: | ||||||||
| Gold sales | 46.3 | 16.1 | 188% | |||||
| Copper sales | 31.1 | 10.0 | 211% | |||||
| Total Revenues | 77.4 | 26.1 | 197% | |||||
| Cost of sales (cash) | 56.4 | 19.9 | 184% | |||||
| Cost of sales (non-cash) | 12.3 | 4.3 | 185% | |||||
| Cost of sales (total) | 68.7 | 24.2 | 184% | |||||
| Cash provided by (used in) operations | 12.4 | (42.4 | ) | 129% | ||||
| Cash provided by (used in) operations before changes in working capital(1) | 16.6 | (6.7 | ) | 348% | ||||
| Operating Highlights: | ||||||||
| Tonnes mined - 000s | 9,305 | 7,572 | 23% | |||||
| Tonnes ore mined – 000s | 2,550 | 2,230 | 14% | |||||
| Tonnes milled - 000s | 2,430 | 1,738 | 40% | |||||
| Mill Head Grade Copper (%) | 0.27 | % | 0.20 | % | 34% | |||
| Mill Head Grade Gold (g/t) | 0.62 | 0.79 | (21%) | |||||
| Copper Recovery - % | 82.5 | % | 83.6 | % | (1%) | |||
| Gold Recovery - % | 70.1 | % | 69.9 | % | 0% | |||
| Mining costs - total ($/t mined material) | $ | 2.05 | $ | 2.37 | (14%) | |||
| Milling costs - total ($/t milled material) | $ | 10.08 | $ | 4.96 | 103% | |||
| Concentrate Produced (dmt) | 25,811 | 13,536 | 91% | |||||
| Payable Copper Produced (000's lbs) (4) | 11,440 | 6,143 | 86% | |||||
| Payable Gold Produced (oz) (4) | 33,255 | 29,544 | 13% | |||||
| Gold Sales (payable oz)(4) | 46,184 | 15,513 | 198% | |||||
| Copper Sales (000's payable lbs)(4) | 12,522 | 4,506 | 178% | |||||
| Average Realized Price - Gold (combined) - $/oz (1) (3) | $ | 1,003 | $ | 1,037 | (3%) | |||
| Average Realized Price - Copper (combined) - $/lb (1) (3) | $ | 2.49 | $ | 2.22 | 12% | |||
| Capital Expenditures (sustaining) (1) - cash | 10.7 | 12.8 | (16%) | |||||
| Capital expenditures (total) | 10.7 | 12.8 | (16%) | |||||
| Operating Costs (on a sales basis) ('000s) (2) | 56.5 | 19.9 | 184% | |||||
| Adjusted Operating costs- $/oz sold (1) | 580 | 702 | (17%) | |||||
| Gold - All in Sustaining costs on a by-product basis - $/oz sold (1) | 842 | 1,554 | (45%) | |||||
| Gold - All in Sustaining costs on a by-product basis (including taxes) - $/oz sold (1) | 860 | 1,565 | (44%) | |||||
| Gold - All in Sustaining costs on a co-product basis - $/oz sold (1) | 958 | 1,303 | (26%) | |||||
| Copper - All in Sustaining costs on a co-product basis - $/pound sold (1) | 2.06 | 3.08 | (33%) | |||||
| (1) | Non-GAAP measure. See discussion under “Non-GAAP Measures” | |
| (2) | Operating costs (on a sales basis) is comprised of mine operating costs such as mining, processing, site and regional office administration, royalties and production taxes, but excludes reclamation costs and depreciation, depletion and amortization. | |
| (3) | The average realized price of gold is a combination of market price paid by third parties and $435 per ounce paid by Royal Gold, while the average realized price of copper is a combination of market price paid by third parties and 15% of the spot price per metric tonne of copper delivered paid by Royal Gold, in each case under the Mount Milligan Streaming Arrangement. | |
| (4) | Mount Milligan payable production and sales are presented on a 100% basis (the Mount Milligan Streaming Agreement entitles it to 35% and 18.75% of gold and copper sales, respectively). Under the Mount Milligan Streaming Arrangement, Royal Gold will pay $435 per ounce of gold delivered and 15% of the spot price per metric tonne of copper delivered. Payable production for copper and gold reflects estimated metallurgical losses resulting from handling of the concentrate and payable metal deductions, subject to metal content, levied by smelters. The current payable percentage applied is approximately 95% for copper and 97.5% for gold, which may be revised on a prospective basis after sufficient history of payable amounts is determined. |
Production:
During the first quarter of 2019, material was mined from phases 3, 4 and 8 (Southern Star pit). Stripping at the north side of phase 8 provided access to the required till material for this year’s tailing storage facility dam construction. The total tonnes mined in the first quarter of 2019 was 9.3 million tonnes and total tonnes moved was 9.7 million tonnes compared to 7.6 million tonnes mined and 8.1 million tonnes moved in the same quarter of 2018.
Total mill throughput was 2.4 million tonnes in the first quarter of 2019 compared to 1.7 million tonnes in the first quarter of 2018. For the quarter ended March 31, 2019, mill throughput averaged 27,000 tonnes per calendar day (roughly 32,000 tonnes per operating day), compared to 19,000 tonnes per calendar day (roughly 30,000 tonnes per operating day) in the same quarter of 2018.
For the first quarter of 2019, total payable gold production was 33,255 ounces compared to 29,544 ounces in the comparative quarter of 2018. Total payable copper was 11.4 million pounds in the first quarter of 2019 compared to 6.1 million pounds in the same quarter of 2018.
Operating costs and All-in Measures:
Operating costs (on a sales basis)NG, in the first quarter of 2019 was $56.5 million compared to $19.9 million in the first quarter of 2018. Operating costs in the first quarter of 2019 were higher than the same quarter of 2018 mainly due to higher sales volumes.
The movements in the major components of operating costs (mining, milling and site support), before changes in inventory, is explained below:
A photo accompanying this announcement is available at http://www.globenewswire.com/NewsRoom/AttachmentNg/ec7c7cbc-f89d-4a72-bed4-8fe8ff9a264b
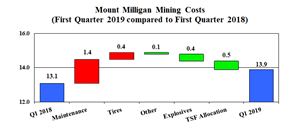
Mining costs totalled $13.9 million in the first quarter of 2019, which was $0.8 million higher than the comparative quarter of 2018. The increase in costs for the first quarter of 2019 includes higher maintenance costs ($1.4 million) resulting from a credit received in 2018 for the settlement of a long-term maintenance agreement and higher tire costs ($0.4 million) due to higher consumption. This was partially offset by higher tailings storage facility allocation costs ($0.5 million) due to more waste mined and moved to the tailings storage facility and lower explosive costs ($0.4 million) due to the impact of a reduced powder factor.
A photo accompanying this announcement is available at http://www.globenewswire.com/NewsRoom/AttachmentNg/9bd12496-8005-436b-a8ff-bdbc74cbdf0d
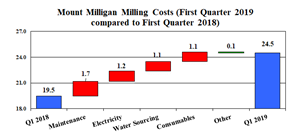
Milling costs totalled $24.5 million in the first quarter of 2019 compared to $19.5 million in the comparative quarter of 2018. The increase in operating costs was mainly due to higher mill throughput which resulted in higher electricity costs ($1.2 million), higher water sourcing costs ($1.1 million) and higher milling consumables costs ($1.1 million). In addition, maintenance costs were higher ($1.7 million) resulting from additional conveyor relining.
Site support costs in the first quarter of 2019 totalled $10.9 million compared to $10.5 million in the first quarter of 2018. The increase in site support costs include higher royalties costs ($1.3 million) due to higher product sales which was partially offset by lower transportation costs ($0.6 million) resulting from the implementation of IFRS 16 for long-term service agreements which capitalized the cost of these agreements and lower maintenance costs for site facilities ($0.3 million).
Other Cost movements:
DD&A was $12.3 million in the first quarter of 2019 compared to $4.3 million in the comparative quarter of 2018, reflecting increased production and sales levels.
All-in sustaining costs before tax on a by-product basis per ounce sold NG was $842 in the first quarter of 2019 compared to $1,554 in the first quarter of 2018. The unit cost decrease results mainly from recording three shipments in first quarter of 2019 compared to only one shipment in the first quarter of 2018.
Including income taxes, all-in sustaining costs on a by-product basis per ounce sold NG was $860 in the first quarter of 2019 compared to $1,565 in the first quarter of 2018.
Molybdenum Business
The molybdenum business includes two North American primary molybdenum mines that are currently on care and maintenance: the Thompson Creek Mine ("TC Mine") (mine and mill) in Idaho and the 75%-owned Endako Mine (mine, mill and roaster) in British Columbia. The molybdenum business also includes the Langeloth metallurgical roasting facility (the "Langeloth Facility") in Pennsylvania. TC Mine operates a molybdenum beneficiation circuit to treat molybdenum concentrates to supplement the concentrate feed sourced directly for the Langeloth Facility. This beneficiation process allows the Company to process high copper content molybdenum concentrate purchased from third parties, which is then transported from TC Mine to the Langeloth Facility for further processing.
The molybdenum business provides tolling treatment services for customers by converting molybdenum concentrates to molybdenum oxide powder and briquettes and ferromolybdenum products. Additionally, molybdenum concentrates are also purchased to convert to upgraded products which are then sold in the metallurgical and chemical markets.
| Molybdenum Operating Results | |||||||
| ($ millions, except as noted) | Three months ended March 31, | ||||||
| 2019 | 2018 | % Change | |||||
| Financial Highlights: | |||||||
| Molybdenum (Mo) Sales - $ millions | 58.6 | 54.1 | 8% | ||||
| Tolling, Calcining and Other | 3.0 | 2.2 | 36% | ||||
| Total Revenues and Other Income | 61.6 | 56.3 | 9% | ||||
| Cost of sales - cash | 61.2 | 48.9 | 25% | ||||
| Cost of sales - non-cash | 1.2 | 1.4 | (14%) | ||||
| Cost of Sales - Total | 62.4 | 50.3 | 24% | ||||
| Care & Maintenance costs - Molybdenum mines (2) | 3.6 | 2.6 | 39% | ||||
| Total capital expenditure | 0.2 | 0.2 | - | ||||
| Cash used in operations | (0.6 | ) | (9.2 | ) | 93% | ||
| Cash (used in) provided by operations, before changes in working capital(1) | (2.7 | ) | 4.3 | (163%) | |||
| Production Highlights (000's lbs): | |||||||
| Mo oxide purchased | 4,229 | 4,034 | 5% | ||||
| Mo oxide roasted | 4,809 | 4,307 | 12% | ||||
| Mo sold | 4,592 | 4,431 | 4% | ||||
| Toll roasted and upgraded Mo | 1,654 | 1,241 | 33% | ||||
(1) Cash (used in) provided by operations before changes in working capital, is a non-GAAP measure and is discussed under “Non-GAAP Measures”.
(2) First quarter 2019 includes $1.1 million non-cash items (first quarter 2018 $0.1 million).
First Quarter 2019 compared to First Quarter 2018
In the first quarter of 2019, 4.8 million pounds of molybdenum oxide was roasted, 11.7% higher than in the first quarter of 2018, due in part to the timing of concentrate purchases which were more significant at the end of 2018 versus end of 2017. Toll roasted and upgraded molybdenum was 33.3% higher in the first quarter of 2019 compared to the same period of 2018, due to increased demand for upgraded molybdenum oxide.
A total of 4.6 million pounds of molybdenum were sold and 1.7 million pounds were tolled in the first quarter of 2019 resulting in sales revenue of $61.6 million. The Company’s average molybdenum sale price for the first quarter of 2019 was $12.77 per pound compared to $12.22 per pound in the comparative quarter of 2018.
In the first quarter of 2019, the molybdenum business consumed $2.7 million of cash from the operations before changes in working capitalNG, and after spending $2.5 million on care and maintenance expenses at the two molybdenum mines and capital spending of $0.2 million. After changes in working capital the molybdenum business used $0.6 million in the first quarter of 2019 versus a use of $9.2 million in the comparative quarter of 2018.
Construction and Development Projects
Öksüt Construction Project:
The Öksüt Project is a gold deposit situated in Turkey approximately 300 kilometres southeast of Ankara and 48 kilometres south of Kayseri, the provincial capital. The nearest administrative centre is at Develi (population 64,000) located approximately 10 kilometres north of the Project. Öksüt Madencilik Sanayi ve Ticaret Anonim Sirketi (OMAS), a wholly-owned subsidiary of the Company, owns the rights to mine and explore the Öksüt Project.
Construction Highlights – First Quarter 2019:
As at March 31, 2019 the Öksüt Project construction is approximately 49% complete. The following summarizes construction activities during the first quarter of 2019:
- Roads and drainage are roughly 77% complete, including the haul road access to the Keltepe Pit location which is now complete.
- The water supply pipeline from the well area to the mine site has been installed and tested. Water storage tanks have been installed.
- Construction of the power sub-station is approximately 86% complete, including installation of the step-down transformer and on-going installation of the control room.
- During the quarter, work on structural steel at both primary and secondary crushers was advanced.
- Vibrating screen/deck feeders and stacker conveyors have been installed.
- Construction on the ADR (absorption, desorption, and refining) plant continued in the quarter, with 90% of the structural steel completed. Cladding of the building is 80% complete. Half of the CIC (carbon in columns) tanks are in position; carbon tanks are installed; electrowinning cells are installed; filter press is installed; construction of the barron solution tanks is ongoing.
- The HDPE (high density polyethylene) liner for the heap-leach area phases 1A, 1B and 1C is on-site.
- Construction of the administration buildings is nearing completion.
The project is on time and on budget and the Company continues to expect that the first gold pour from the Öksüt Project will occur in the first quarter of 2020.
During the first quarter of 2019, the Company spent $15.3 million, mainly on development activities and associated fees as explained above.
In the comparative periods of 2018, the Company spent $5.4 million on development activities to progress access and site preparation and detailed engineering plans.
Kemess Underground Project:
The Kemess Project is located in north-central British Columbia, Canada, approximately 250 kilometres north of Smithers, 430 kilometres northwest of Prince George and 209 kilometres from the Mount Milligan mine. The Kemess Project site (or “Kemess”) includes infrastructure from the past producing Kemess South mine. There are currently no mining activities at the Kemess site and on-site activities consist of care and maintenance work and initial surface construction and development activities for the proposed Kemess Underground Project.
In the first quarter of 2019, the Company spent $3.7 million on care and maintenance and $4.6 million on capital expenditures at Kemess, including engineering and commissioning of a water treatment plant to meet permit requirements governing water discharge quality. Capital expenditures included engineering and commissioning of the water discharge system, water treatment plant and mobile equipment purchases. Comparatively, the Company spent $1.4 million and $0.6 million on care and maintenance and pre-development activities in the first quarter of 2018.
On July 6, 2018, the Company received its amended Mines Act Permit approving the Kemess underground mine plan and reclamation program for the Kemess Underground Project. This permit allows the Company to commence construction activities associated with a water treatment and water discharge system, and would allow the Company to proceed with other construction activities. On September 21, 2018, the Company received its effluent discharge permit which allows discharging treated water from the site. On April 8, 2019, the Company received the amended air emissions permit.
Planned activities for 2019 include continued care and maintenance, water discharge system construction and commissioning, water treatment plant construction and commissioning, and Kemess Underground Project engineering and optimization studies.
Greenstone Gold Property:
The Greenstone Gold property is located in northern Ontario, Canada approximately 275 kilometres northeast of Thunder Bay, Ontario.
On March 26, 2019, the Provincial Environmental Assessment (“EA”) for the Hardrock Project (the "Project”) was approved by the Minister of Environment, Conservation & Parks of Ontario. The Federal EA was approved on December 13, 2018 by the Minister of Environment and Climate Change of Canada. The receipt of provincial and federal EA approvals are significant milestones for the Project and allows the Company to move forward with the submission of permits.
During the first quarter of 2019, the Company spent $10.0 million, mainly on advancing detailed engineering on infrastructure programs, permitting activities and on a core and reverse circulation drilling program. As at March 31, 2019, Centerra’s funding towards its C$185 million commitment in the Greenstone Partnership totalled C$100.2 million ($76.9 million).
Quarterly Results – Previous Eight Quarters
Over the last eight quarters, Centerra’s results reflect the impact of decreasing input costs (mainly for consumables), except for diesel fuel prices which increased over 2017 and 2018. Over the same periods, gold prices progressively increased over the 2017 year, stabilizing into the first half of 2018 and declining in the third and fourth quarters. In 2017, the Euro, Canadian dollar and Kyrgyz som appreciated against the U.S. dollar thereby putting pressure on operating costs spent in these currencies. In 2018, the Canadian dollar, Euro and Kyrgyz som depreciated against the U.S. dollar benefiting operating costs spent in these currencies. The Company reduced its carrying value of its former Mongolian assets by $41.3 million (pre-tax) in the second quarter of 2017 and recorded a provision of $60 million in connection with the Strategic Agreement with the Kyrgyz Government in the third quarter of 2017. An after-tax gain of $21.3 million on the sale of the Company’s royalty portfolio and an after-tax gain of $9.4 million on the final instalments of the ATO property sale (gain of $6.9 million on the initial instalment booked in the third quarter of 2017) were recorded in the second quarter of 2018. The third quarter of 2018 included a charge to impair the carrying value of the Company’s Mongolian business unit of $8.4 million (included in loss from discontinued operations), in relation to the Company’s sale of its Mongolian business unit. An increase in reclamation expenses of $41.8 million was recorded in the fourth quarter of 2018 mainly to record an increase in water treatment costs at Thompson Creek Mine. The quarterly production profile at Kumtor for 2017 was more consistent across each quarter, while in 2018 it was more concentrated in the last half of the year, impacting mostly the fourth quarter. Non-cash costs have progressively increased at Kumtor due to its expanded mining fleet and the increased amortization of capitalized stripping resulting from increased stripping as the Central pit has become larger. The quarterly financial results for the last eight quarters are shown below:
| $ million, except per share data | 2019 | 2018 | 2017 | |||||
| Quarterly data unaudited | ||||||||
| Q1 | Q4 | Q3 | Q2 | Q1 | Q4 | Q3 | Q2 | |
| Revenue | 334 | 392 | 259 | 243 | 235 | 358 | 276 | 279 |
| Net earnings (loss) | 50 | 49 | 6 | 44 | 9 | 130 | (1) | 23 |
| Basic earnings (loss) per share | 0.17 | 0.17 | 0.02 | 0.15 | 0.03 | 0.45 | - | 0.08 |
| Diluted earnings (loss) per share | 0.17 | 0.17 | 0.01 | 0.15 | 0.03 | 0.43 | - | 0.08 |
Other Corporate Developments
The following is a summary of corporate developments with respect to matters affecting the Company and its subsidiaries. Readers are cautioned that there are a number of legal and regulatory matters that are currently affecting the Company and that the following is only a brief summary of such matters. For a more complete discussion of these matters, see the Company’s news releases and its 2018 Annual Information Form and specifically the section entitled “Risks that can affect our business” therein available on SEDAR at www.sedar.com. The following summary also contains forward-looking statements and readers are referred to “Caution Regarding Forward-looking Information”.
Kyrgyz Republic
Strategic Agreement
As previously disclosed, Centerra and its Kyrgyz subsidiaries (Kumtor Gold Company (“KGC”) and Kumtor Operating Company) entered into a comprehensive settlement agreement (the “Strategic Agreement”) with the Government of the Kyrgyz Republic (the “Kyrgyz Government”) on behalf of the Kyrgyz Republic on September 11, 2017. The Strategic Agreement includes, among other things:
- full and final reciprocal releases and resolution of all existing arbitral and environmental claims, disputes, proceedings and court orders, and releases of the Company and its Kyrgyz subsidiaries from future claims covering the same subject matter as the existing environmental claims arising from approved mine activities;
- the agreement of KGC to:
- make a one-time lump sum payment totaling $57 million to a new, government-administered Nature Development Fund ($50 million) following closing and to a new, government administered Cancer Care Support Fund ($7 million); the $7 million to the Cancer Care Support Fund was paid in 2017;
- within 12 months of closing make a further one-time payment of $3 million to the new, government administered Cancer Care Support Fund;
- make annual payments of $2.7 million to the Nature Development Fund, conditional on the Government continuing to comply with its obligations under the Strategic Agreement; and
- accelerate its annual payments to Kumtor’s Reclamation Trust Fund in the amount of $6 million a year until the total amount contributed by KGC reaches the total estimated reclamation cost for the Kumtor Project (representing the independent assessment of Kumtor’s current reclamation costs) subject to a minimum total reclamation cost of $69 million (which is broadly in line with KGC’s current estimated reclamation cost for the Kumtor Project);
- make a one-time lump sum payment totaling $57 million to a new, government-administered Nature Development Fund ($50 million) following closing and to a new, government administered Cancer Care Support Fund ($7 million); the $7 million to the Cancer Care Support Fund was paid in 2017;
The releases of liability and outstanding payments are subject to a range of initial conditions precedent designed to protect Centerra, KGC and KOC, including (i) the approval by the Kyrgyz Government of various outstanding items, including the Kumtor life-of-mine (LOM) plan, official reserves report and the tailings dam expansion, (ii) compliance by the Kyrgyz Government with its obligations under the project agreements entered into by the Government, KOC and KGC in 2009 (the “Kumtor Project Agreements”), (iii) continued operation of the Kumtor Mine by KGC and KOC with all necessary permits, (iv) no expropriatory action having been taken by the Kyrgyz Government, and (v) termination of the environmental disputes and the civil and criminal proceedings instigated by the Kyrgyz General Prosecutor’s Office on terms satisfactory to Centerra. The Kyrgyz Government approvals noted in (i) above have all been obtained and most of the civil and criminal proceedings (other than the SIETS environmental claims discussed below) have been terminated.
The Company is continuing to work closely with the Kyrgyz Government to expeditiously satisfy the remaining conditions precedent to the Strategic Agreement, including the termination of certain legal proceedings. The initial longstop date for the satisfaction of all of the conditions precedent to completion of the Strategic Agreement has been extended by agreement of all the parties a number of times, most recently to May 31, 2019.
In connection with the Strategic Agreement, the arbitration previously commenced by Centerra, KGC and KOC against the Government of the Kyrgyz Republic and Kyrgyzaltyn has been suspended until May 31, 2019. During the suspension, the parties will work towards completing the Strategic Agreement and the resolution of all outstanding matters affecting the Kumtor Project.
Kyrgyz Republic Claims
SIETS Claims
As previously disclosed, on May 25, 2016, the Bishkek Inter-District Court in the Kyrgyz Republic ruled against Kumtor Operating Company (“KOC”), Centerra’s wholly-owned subsidiary, on two claims made by the State Inspectorate Office for Environmental and Technical Safety of the Kyrgyz Republic (“SIETS”) in relation to the placement of waste rock at the Kumtor waste dumps and unrecorded wastes from Kumtor’s effluent and sewage treatment plants. The Inter-District Court awarded damages of 6,698,878,290 Kyrgyz soms (approximately $96.6 million at current exchange rates) and 663,839 Kyrgyz soms (approximately $9,600 at current exchange rates), respectively. On June 1, 2016, the Inter-District Court ruled against KOC on two other claims made by SIETS in relation to alleged land damage and failure to pay for water use. The Inter-District Court awarded damages of 161,840,109 Kyrgyz soms (approximately $2.3 million) and 188,533,730 Kyrgyz soms (approximately $2.7 million), respectively.
On March 27, 2018, upon the application of SIETS, the Bishkek City Court terminated each of the SIETS claims noted above. However, in April 2018, SIETS successfully appealed the decisions to terminate these claims and the claims have been returned to the court of first instance for further consideration. Despite this development, the Company expects these claims to be resolved in connection with the Strategic Agreement.
Kyrgyz Republic General Prosecutor’s Office Proceedings
The Company is and was subject to a number of other criminal proceedings commenced by the Kyrgyz Republic General Prosecutor’s Office and other Kyrgyz Republic state agencies as described below.
Criminal Investigation into Environmental Matters
KGC is also aware of an outstanding criminal investigation in the Kyrgyz Republic which concerns the same subject matter as the SIETS claims described above. The Company expects that this investigation will be terminated in connection with the Strategic Agreement.
Land Use Claim
As previously noted, KGC had challenged the purported 2012 cancellation of its land use (surface) rights over the Kumtor concession areas in the Kyrgyz Republic courts as well as in its arbitration claim (described above). On August 28, 2017, the Bishkek Inter-District Court terminated the proceeding commenced by the GPO in respect of Kumtor’s land use rights over the Kumtor concession area. The Company received new land use certificates on January 24, 2019.
Kyrgyz State Tax Orders
In August 2018, KGC commenced a claim in the Kyrgyz courts (refiled on September 26, 2018) seeking to invalidate orders of the Kyrgyz Republic State Tax Service which reassessed taxes (including sanctions and penalties) owing from KGC for the period from 2016 to 2017 in the amount of 1,377,709,739.44 Kyrgyz Soms (approximately $20 million), primarily in relation to the alleged failure to pay taxes on high altitude premiums paid to employees at the Kumtor mine site. The Kyrgyz court held a hearing in December 2018 and satisfied KGC’s claim to invalidate the orders. This court decision came into effect on January 10, 2019 after the customary appeal period expired.
GPO Review of Kumtor Project Agreements
On June 14, 2016, according to reports in the Kyrgyz Republic, the Kyrgyz Republic President instructed the GPO to investigate the legality of the agreements relating to the Kumtor Project which were entered into in 2003, 2004 and 2009. The 2009 Restated Investment Agreement governing the Kumtor Project which was entered into in 2009 superseded entirely the 2003 and 2004 agreements. The 2009 Restated Investment Agreement was negotiated with the Kyrgyz Republic Government, Kyrgyzaltyn and their international advisers, and approved by all relevant Kyrgyz Republic state authorities, including the Kyrgyz Republic Parliament and any disputes under the 2009 Restated Investment Agreement are subject to resolution by international arbitration. The Company understands that this investigation has been closed with respect to certain individuals.
Management Assessment of Outstanding Kumtor Matters
As noted above, the Strategic Agreement contained no admission on the part of Centerra or its Kyrgyz subsidiaries of: (i) any environmental wrongdoing, (ii) any non-compliance with Kyrgyz law or the Kumtor Project Agreements or (iii) any pre-existing obligation to make additional environmental or Reclamation Trust Fund payments or environmental remediation efforts. The Company and KGC continue to dispute all of the allegations noted above.
While the Strategic Agreement provides a pathway for the resolution of all outstanding matters affecting the Kumtor Project, there are no assurances that all of the conditions precedent to the completion of the settlement contained in the Strategic Agreement will be satisfied. If the settlement contained in the Strategic Agreement is not completed, there are no assurances that (i) the Company will be able to successfully resolve any or all of the outstanding matters affecting the Kumtor Project or that any future discussions between the Kyrgyz Republic Government and Centerra will result in a mutually acceptable resolution; or (ii) the Kyrgyz Republic Government and/or Parliament will not take actions that are inconsistent with the Government’s obligations under the Strategic Agreement or Kumtor Project Agreements, including adopting a law “denouncing” or purporting to cancel or invalidate the Kumtor Project Agreements or laws enacted in relation thereto which have the effect of nationalization of the Kumtor Project.
The inability to successfully resolve all such matters, whether through the Strategic Agreement or otherwise, could lead to suspension of operations of the Kumtor Project and would have a material adverse impact on the Company’s future cash flows, earnings, results of operations and financial condition.
Furthermore, if all such claims are not resolved as provided for in the Strategic Agreement and despite the Company’s view that all disputes related to the 2009 Restated Investment Agreement should be determined in arbitration, there are risks that the arbitrator may (i) reject the Company’s claims; (ii) determine it does not have jurisdiction; and/or (iii) stay the arbitration pending determination of certain issues by the Kyrgyz Republic courts. Even if the Company receives an arbitral award in its favour against the Kyrgyz Republic and/or Kyrgyzaltyn, there are no assurances that it will be recognized or enforced in the Kyrgyz Republic. Accordingly, the Company may be obligated to pay part of or the full amounts of, among others, the SIETS claims and the Kyrgyz State tax orders, regardless of the action taken by the arbitrator. The Company does not have insurance or litigation reserves to cover these costs. If the Company were obligated to pay these amounts, it would have a material adverse impact on the Company’s future cash flows, earnings, results of operations and financial condition.
Other
In 2018, the Company initiated a review of its long-term water treatment options at the Endako Mine, as a result of ongoing discussions concerning mine reclamation obligations among regulatory and industry bodies in British Columbia. These discussions are ongoing but may result in amended regulations in 2019. As a result, the Company expects to update its technical studies and environmental studies for the Endako mine later in 2019, the result of which may require an increase to Endako’s asset retirement obligation.
The Company operates in multiple countries around the world and accordingly is subject to, and pays, taxes under the various regimes in those jurisdictions in which it operates. These tax regimes are determined under general corporate income tax and other laws of the respective jurisdiction. The Company has historically filed, and continues to file, all required tax returns and to pay the taxes reasonably determined to be due. The tax rules and regulations in many countries are complex and subject to interpretation. From time to time the Company’s tax filings are subject to review and in connection with such reviews disputes can arise with the taxing authorities over the Company’s interpretation of the country’s tax laws. The Company records provisions for future disbursements considered probable. As at March 31, 2019, the Company did not have any material provision for claims or taxation assessments.
Accounting Estimates, Policies and Changes
Accounting Estimates
The preparation of the Company’s consolidated financial statements in accordance with IFRS required management to make estimates and judgments that affect the amounts reported in the consolidated financial statements and accompanying notes. The critical estimates and judgments applied in the preparation of the Company’s condensed consolidated interim financial statements for the three months ended March 31, 2019 are consistent with those used in the Company’s consolidated financial statements for the year ended December 31, 2018, with the exceptions listed in note 3 of the condensed consolidated interim financial statements.
The key sources of estimation uncertainty and judgment used in the preparation of the consolidated financial statements that have a significant risk of causing a material adjustment to the carrying amounts of assets and liabilities and earnings within the next financial year are outlined in detail in note 4 of the December 31, 2018 financial statements.
Recently adopted and recently issued but not adopted accounting guidance
Note 3 in the condensed consolidated interim financial statements for the three months ended March 31, 2019 presents a list of recently issued accounting standards either adopted or not yet adopted by the Company, provides a brief description on the nature of these changes and potential impact on the Company. On January 1, 2019, the Company adopted IFRS 16, Leases, that revises the definition of leases and requires companies to bring most leases on-balance sheet. IFRS 16 was adopted using the modified retrospective approach which resulted with the recording of additional lease liabilities of $21.0 million and the recording of a right-of-use asset as part of property, plant and equipment. IFRIC 23, Uncertainty over Income Tax Treatments, was also adopted on January 1, 2019 with minimal impact.
Disclosure Controls and Procedures and Internal Control Over Financial Reporting (“ICFR”)
The Company’s management, including the CEO and CFO, is responsible for the design of disclosure controls and procedures (“DC&P”) and internal controls over financial reporting (“ICFR”). Centerra adheres to the Committee of Sponsoring Organizations of the Treadway Commission’s (COSO) revised 2013 Internal Control Framework for the design of its ICFR. There was no material change to the Company’s internal controls over financial reporting that occurred during the first quarter of 2019 that has materially affected, or is reasonably likely to materially affect, the Company’s internal controls over financial reporting.
The evaluation of DC&P and ICFR was carried out under the supervision of and with the participation of management, including Centerra’s CEO and CFO. Based on these evaluations, the CEO and the CFO concluded that the design and operation of these DC&P and ICFR were effective throughout the first quarter of 2019.
2019 Outlook
Production, cost and capital forecasts for 2019 are forward-looking information and are based on key assumptions and subject to material risk factors that could cause actual results to differ materially. These risks are discussed herein under the headings “Risks That Can Affect Our Business”, “Material Assumptions & Risks” and “Caution Regarding Forward-Looking Information” in this document. Also refer to the Company’s most recent Annual Information Form and specifically the section entitled “Risks That Can Affect Our Business” therein available on SEDAR.
2019 Gold Production
Centerra’s 2019 gold production is expected to be between 690,000 to 740,000 ounces, which is unchanged from the previous guidance disclosed in the Company’s news release of February 22, 2019. As previously disclosed, Kumtor’s gold production forecast is expected to be in the range of 535,000 ounces to 565,000 ounces, with slightly lower production levels expected in the second and third quarter of 2019 compared to the first quarter performance, and approximately 28% of the production expected to be in the fourth quarter of 2019. At Mount Milligan, mill throughput is expected to return to full capacity once the spring melt has commenced. In the second half of 2019, the Company expects Mount Milligan to achieve an average daily throughput of approximately 55,000 tonnes per calendar day. For the full year, the Company expects Mount Milligan’s total (streamed and unstreamed) payable gold production to be unchanged and in the range of 155,000 to 175,000 ounces.
Centerra’s 2019 guidance for production, exploration, capital spending, corporate administration, and DD&A expense is unchanged from the previous guidance disclosed in the Company’s news release of February 22, 2019.
2019 Copper Production
Centerra expects total (streamed and unstreamed) payable copper production from the Mount Milligan Mine to be in the range of 65 million pounds to 75 million pounds, which is unchanged from the previous guidance.
Centerra’s 2019 production is forecast as follows:
| 2019 Production Guidance | Units | Kumtor | Mount Milligan(1) | Centerra | |
| Gold(2) | |||||
| Unstreamed Gold Payable Production | (Koz) | 535 – 565 | 101 – 114 | 636 – 679 | |
| Streamed Gold Payable Production(1) | (Koz) | – | 54 – 61 | 54 – 61 | |
| Total Gold Payable Production(2) | (Koz) | 535 – 565 | 155 – 175 | 690 – 740 | |
| Copper(3) | |||||
| Unstreamed Copper Payable Production | (Mlb) | – | 53 – 61 | 53 – 61 | |
| Streamed Copper Payable Production(1) | (Mlb) | – | 12 – 14 | 12 – 14 | |
| Total Copper Payable Production(3) | (Mlb) | – | 65 – 75 | 65 – 75 |
- The Mount Milligan Streaming Arrangement entitles Royal Gold to 35% and 18.75% of gold and copper sales, respectively, from the Mount Milligan mine and requires Royal Gold to pay $435 per ounce of gold delivered and 15% of the spot price per metric tonne of copper delivered.
- Gold production assumes 81.6% recovery at Kumtor and 60.0% recovery at Mount Milligan.
- Copper production assumes 81.8% recovery for copper at Mount Milligan.
2019 All-in Sustaining Unit Costs NG
Centerra’s 2019 all-in sustaining costs per ounce sold NG on a by-product and co-product basis are unchanged from the previous guidance and are forecast as follows:
| 2019 All-in Sustaining Unit Costs NG (4) | Kumtor | Mount Milligan(2) | Centerra(2) |
| Ounces sold forecast | 535,000 – 565,000 | 155,000 – 175,000 | 690,000-740,000 |
| All-in sustaining costs on a by-product basis(1), (2) | $666 - $703 | $727 - $821 | $723 – $775 |
| Revenue-based tax(3) and taxes(3) | 171 – 180 | 21 - 24 | 135 – 145 |
| All-in sustaining costs on a by-product basis, including taxes (1), (2), (3) | $837 – $883 | $748 – $845 | $858 – $920 |
| Gold - All-in sustaining costs on a co-product basis ($/ounce) (1),(2) | $666 - $703 | $803 - $906 | $741 - $795 |
| Copper - All-in sustaining costs on a co-product basis ($/pound) (1),(2) | – | $1.93 - $2.23 | $1.93 – $2.23 |
| 1) | All-in sustaining costs per ounce sold, all-in sustaining costs per ounce sold on a by-product basis, all-in sustaining costs on a by-product basis including taxes per ounce sold and all-in sustaining costs on a co-product basis (gold and copper) on a per unit basis are non-GAAP measures and are discussed under “Non-GAAP Measures”. | |
| 2) | Mount Milligan payable production and ounces sold are on a 100% basis (the Mount Milligan Streaming Arrangement entitles Royal Gold to 35% and 18.75% of gold and copper sales, respectively). Unit costs and consolidated unit costs include a credit for forecasted copper sales treated as by-product for all-in sustaining costs and all-in sustaining costs plus taxes. The copper sales are based on a copper price assumption of $2.80 per pound sold for Centerra’s 81.25% share of copper production and the remaining 18.75% of copper revenue at $0.42 per pound (15% of spot price, assuming spot at $2.80 per pound), representing the Mount Milligan Streaming Arrangement. Payable production for copper and gold reflects estimated metallurgical losses resulting from handling of the concentrate and payable metal deductions, subject to metal content, levied by smelters. | |
| 3) | Includes revenue-based tax at Kumtor and the British Columbia mineral tax at Mount Milligan based on a forecast gold price assumption of $1,200 per ounce sold. | |
| 4) | Results in chart may not add due to rounding. |
Sensitivities
Centerra’s revenues, earnings and cash flows for the remaining nine months of 2019 are sensitive to changes in certain key inputs or currencies. The Company has estimated the impact of any such changes on revenues, net earnings and cash from operations.
| Change |
Impact on ($ millions) |
Impact on ($ per ounce sold) |
|||||
| Costs | Revenues | Cash flows | Net Earnings (after tax) |
AISC(3) on by- product basis |
|||
| Gold price(1) | $50/oz | 4.8 - 5.5 | 29.5 - 31 | 24.4 - 25.7 | 24.4 - 25.7 | 2 - 3 | |
| Copper price(1) | 10 | % | 4.7 - 5.3 | 17.0 - 19.0 | 12.5 - 13.5 | 12.5 - 13.5 | 13 - 17 |
| Diesel fuel | 10 | % | 8.1 - 9.6 | - | 8.1 - 9.6 | 8.1 - 9.6 | 9 - 10 |
| Kyrgyz som(2) | 1 som | 1.0 -1.5 | - | 1.0 -1.5 | 1.0 -1.5 | 2 - 3 | |
| Canadian dollar(2) | 10 cents | 25.4 - 30.4 | - | 25.4 - 30.4 | 22.6 - 27.2 | 30 - 33 | |
| Turkish Lira(2) | 1 lira | 1.5 - 2.2 | - | 1.5 - 2.2 | - | - | |
| (1) | Gold and copper price sensitivities include the impact of the hedging program set up to mitigate gold and copper price risks. | |
| (2) | Appreciation of currency against the U.S. dollar will result in higher costs and lower cash flow and earnings, depreciation of currency against the U.S. dollar results in decreased costs and increased cash flow and earnings. | |
| (3) | Non-GAAP measure. See discussion under “Non-GAAP Measures”. |
Material Assumptions and Risks
Material assumptions or factors used to forecast production and costs for the remaining nine months of 2019 include the following:
- a gold price of $1,200 per ounce,
- a copper price of $2.80 per pound,
- a molybdenum price of $12 per pound,
- exchange rates:
- $1USD:$1.30 Canadian dollar,
- $1USD:69.0 Kyrgyz som,
- $1USD:5.00 Turkish lira,
- $1USD:0.79 Euro,
- diesel fuel price assumption:
- $0.57/litre at Kumtor,
- $0.85/litre (CAD$1.13/litre) at Mount Milligan.
The assumed diesel price of $0.57/litre at Kumtor assumes that no Russian export duty will be paid on the fuel exports from Russia to the Kyrgyz Republic. Diesel fuel for Kumtor is sourced from separate Russian suppliers. The diesel fuel price assumptions were made when the price of oil was approximately $65 per barrel. Crude oil is a component of diesel fuel purchased by the Company, such that changes in the price of Brent crude oil generally impacts diesel fuel prices. The Company established a hedging strategy to manage changes in diesel fuel prices on the cost of operations at the Kumtor mine. The Company targets to hedge up to 50% of crude oil component of monthly diesel purchases exposure.
Other material assumptions were used in forecasting production and costs for the remaining nine months 2019. These material assumptions include the following:
- The Mount Milligan processing facility continues to have access to sufficient water supplies to operate year-round at the intended capacity. This includes management’s expectations of annual average precipitation, reduction in water losses/deferrals to the sands and gravels, continued ability to draw water from existing permitted water surface and groundwater sources, identify and access new water wells available for permitting and capture permittable water sources from within the existing operations.
- The Company and the Kyrgyz Republic Government (“Government”) continue to work constructively to complete the Kumtor Strategic Agreement, the Government does not take any actions that are contrary to the Strategic Agreement and/or the Kumtor Project Agreement and which have a material adverse impact on the Kumtor operations, and the Kyrgyz proceedings are not reinstated or progressed contrary to the terms of the Strategic Agreement and/or the Kumtor Project Agreements.
- The mine plans, expertises and related permits and authorizations at Kumtor which have been received to date for 2019 are not withdrawn and that any further approvals are obtained in a timely manner from relevant governmental agencies in the Kyrgyz Republic.
- Any recurrence of political or civil unrest in the Kyrgyz Republic will not impact operations, including movement of people, supplies and gold shipments to and from the Kumtor mine and/or power to the mine site.
- Any sanctions imposed on Russian entities do not have a negative effect on the costs or availability of inputs or equipment to the Kumtor Project.
- Any political issues in Turkey do not have a negative effect on the Öksüt Project.
- The movement in the Central Valley Waste Dump at Kumtor, initially referred to in the Annual Information Form for the year ended December 31, 2013, and in the Lysii and Sarytor Waste Dumps, does not accelerate and will be managed to ensure continued safe operations, without impact to gold production.
- The buttress constructed at the bottom of the Davidov glacier continues to function as designed.
- The Company can manage the risks associated with the increased height of the pit walls at Kumtor.
- The dewatering program at Kumtor continues to produce the expected results and the water management system works as planned.
- The pit walls at Kumtor and Mount Milligan remain stable and Kumtor continues to successfully manage and mitigate ground movements in the vicinity of the Kumtor mill and cut-back 19.
- The resource block model at Kumtor and Mount Milligan reconcile as expected against production.
- Grades and recoveries at Kumtor and Mount Milligan remain consistent with the 2019 production plan to achieve the forecast gold and copper production.
- The Kumtor mill and the Mount Milligan mill continues to operate as expected, including that there are no unplanned suspension of operations due to (among other things), structural, mechanical or technical performance issues.
- There are no changes to any existing agreements and relationships with affected Indigenous groups which would materially and adversely impact our operations.
- There are no unfavourable changes to concentrate sales arrangements at Mount Milligan and roasting arrangements at the Langeloth facility.
- Third party logistic providers, including Canadian National Railways and port workers in the Port of Vancouver, can meet Centerra’s logistics needs and that a potential labour disruption affecting such port workers will not have a material effect on the Company’s ability to transport or sell concentrate from Mount Milligan.
- There are no adverse regulatory changes affecting the Kumtor and Mount Milligan operations and the Company’s molybdenum assets.
- Exchange rates, prices of key consumables, costs of power, water usage fees, and any other cost assumptions at all operations and projects of the Company are not significantly higher than prices assumed in planning.
- No unplanned delays in or interruption of scheduled production from our mines, including due to climate/weather conditions, political or civil unrest, natural phenomena, regulatory or political disputes, equipment breakdown or other developmental and operational risks.
- The Company and its applicable subsidiaries throughout the year continue to meet the terms of their respective credit facilities to maintain current borrowings and compliance with applicable financial covenants.
The Company cannot give any assurances with respect to the above noted factors.
Production, cost and capital forecasts for 2019 are forward-looking information and are based on key assumptions and subject to material risk factors that could cause actual results to differ materially and which are discussed herein under the headings “Material Assumptions & Risks” and “Caution Regarding Forward-Looking Information” in this document and under the heading “Risks That Can Affect Our Business” in the Company’s most recent Annual Information Form.
Qualified Person & QA/QC – Production Information
The production information and other scientific and technical information presented in this document, including the production estimates were prepared in accordance with the standards of the Canadian Institute of Mining, Metallurgy and Petroleum and NI 43-101 and were prepared, reviewed, verified and compiled by Centerra’s geological and mining staff under the supervision of Gordon Reid, Professional Engineer and Centerra’s Vice- President and Chief Operating Officer, who is the qualified person for the purpose of NI 43-101. Sample preparation, analytical techniques, laboratories used and quality assurance-quality control protocols used during the exploration drilling programs are done consistent with industry standards and independent certified assay labs are used.
Non-GAAP Measures
This document contains the following non-GAAP financial measures: all-in sustaining costs per ounce sold on a by-product basis, all-in sustaining costs per ounce sold on a by-product basis including taxes, and all-in sustaining costs per ounce sold on a co-product basis. In addition, non-GAAP financial measures include operating costs (on a sales basis), adjusted operating costs and adjusted operating costs per ounce sold, as well as capital expenditures (sustaining) and capital expenditures (growth) and cash provided by operations before changes in working capital. These financial measures do not have any standardized meaning prescribed by GAAP and are therefore unlikely to be comparable to similar measures presented by other issuers, even as compared to other issuers who may be applying the World Gold Council (“WGC”) guidelines, which can be found at http://www.gold.org.
Management believes that the use of these non-GAAP measures will assist analysts, investors and other stakeholders of the Company in understanding the costs associated with producing gold, understanding the economics of gold mining, assessing our operating performance, our ability to generate free cash flow from current operations and to generate free cash flow on an overall Company basis, and for planning and forecasting of future periods. However, the measures do have limitations as analytical tools as they may be influenced by the point in the life cycle of a specific mine and the level of additional exploration or expenditures a company has to make to fully develop its properties. Accordingly, these non-GAAP measures should not be considered in isolation, or as a substitute for, analysis of our results as reported under GAAP.
Definitions
The following is a description of the non-GAAP measures used in this MD&A. The definitions are similar to the WGC’s Guidance Note on these non-GAAP measures:
- Production costs represent operating costs associated with the mining, milling and site administration activities at the Company’s operating sites, excluding costs unrelated to production such as mine standby and community costs related to current operations.
- Operating costs (on a sales basis) include mine operating costs such as mining, processing, site support, royalties and operating taxes (except at Kumtor where revenue-based taxes are excluded), but exclude depreciation, depletion and amortization (DD&A), reclamation costs, financing costs, capital development and exploration.
- Adjusted operating costs per ounce sold include operating costs (on a sales basis), regional office administration, mine standby costs, community costs related to current operations, refining fees and by-product credits.
- All-in sustaining costs on a by-product basis per ounce sold include adjusted operating costs, the cash component of capitalized stripping costs, corporate general and administrative expenses, accretion expenses, and sustaining capital, net of copper and silver credits. The measure incorporates costs related to sustaining production. Copper and silver credits represent the expected revenue from the sale of these metals.
- All-in sustaining costs on a by-product basis per ounce sold including taxes, include revenue-based tax at Kumtor and taxes (mining and income) at Mount Milligan.
- All-in sustaining costs on a co-product basis per ounce of gold sold or per pound of copper sold, operating costs are allocated between copper and gold based on production. To calculate the allocation of operating costs, copper production has been converted to ounces of gold equivalent using the copper production for the periods presented, as well as an average of the futures prices during the quotational pricing period for copper and gold sold from Mount Milligan. In the first quarter of 2019, 463 pounds of copper was equivalent to one ounce of gold.
- Adjusted earnings is calculated by adjusting net earnings (loss) as recorded in the condensed interim consolidated statements of income (loss) and comprehensive income (loss) for non-recurring items.
- Capital expenditure (Sustaining) is a capital expenditure necessary to maintain existing levels of production. The sustaining capital expenditures maintain the existing mine fleet, mill and other facilities so that they function at levels consistent from year to year.
- Capital expenditure (Growth) is capital expended to expand the business or operations by increasing productive capacity beyond current levels of performance.
- Growth projects are defined as projects that are beyond the exploration stage but are pre-operational. In the first quarter of 2019, growth projects include Öksüt, Kemess and the Greenstone Gold Property.
- Average realized gold price is calculated by dividing revenue (including third party sales and the fixed amount received under the Mount Milligan Streaming Arrangement) derived from gold sales by the number of ounces sold.
- Average realized copper price is calculated by dividing revenue (including third party sales and the fixed amount received under the Mount Milligan Streaming Arrangement) derived from copper sales by the number of pounds sold.
- Free cash flow (unlevered) is calculated as cash provided by operations less additions to property, plant and equipment.
- Cash provided by operations before changes in working capital starts with cash provided by operations and removes the changes in working capital as presented in the Company’s Statement of Cash Flows.
- Net cash is calculated as cash and cash equivalents, less short and long-term debt (principal only). This measure excludes the restricted cash balance.
Adjusted Operating Cost and All-in Sustaining Costs on a by-product basis (including and excluding taxes) per ounce of gold are non-GAAP measures and can be reconciled as follows:
| Three months ended March 31, | ||||||||||||
| (Unaudited - $ millions, unless otherwise specified) | Consolidated (1) | Kumtor(1) | Mount Milligan(1) | |||||||||
| 2019 | 2018 | 2019 | 2018 | 2019 | 2018 | |||||||
| Cost of sales excluding molybdenum segment, as reported | 160.9 | 102.5 | 92.2 | 78.3 | 68.7 | 24.2 | ||||||
| Less: Non-cash component | 53.3 | 39.9 | 41.0 | 35.6 | 12.3 | 4.3 | ||||||
| Cost of sales, cash component | 107.6 | 62.6 | 51.2 | 42.7 | 56.4 | 19.9 | ||||||
| Adjust for: | ||||||||||||
| Regional office administration | 2.9 | 2.8 | 2.9 | 2.8 | - | - | ||||||
| Selling and marketing | 1.2 | 0.9 | - | - | 1.2 | 0.9 | ||||||
| Refining fees | 1.4 | 1.2 | 1.2 | 1.1 | 0.2 | 0.1 | ||||||
| By-product credits - copper | (31.1 | ) | (10.0 | ) | - | - | (31.1 | ) | (10.0 | ) | ||
| Community costs related to current operations | 1.1 | 1.7 | 1.1 | 1.7 | - | - | ||||||
| Adjusted Operating Costs | 83.1 | 59.1 | 56.4 | 48.3 | 26.7 | 10.9 | ||||||
| Corporate general administrative and other costs | 9.4 | 10.6 | - | - | 0.2 | 0.3 | ||||||
| Accretion expense | 0.5 | 0.5 | 0.4 | 0.3 | 0.1 | 0.2 | ||||||
| Capitalized stripping and ice unload | 17.4 | 28.7 | 17.4 | 28.7 | - | - | ||||||
| Capital expenditures (sustaining) | 19.8 | 24.6 | 8.9 | 11.3 | 10.7 | 12.8 | ||||||
| Lease principal payments | 1.2 | - | - | - | 1.2 | - | ||||||
| All-in Sustaining Costs on a by-product basis | 131.4 | 123.5 | 83.1 | 88.7 | 38.9 | 24.1 | ||||||
| Revenue-based taxes | 27.4 | 21.6 | 27.4 | 21.6 | - | - | ||||||
| Income and mining taxes | 0.8 | 0.2 | - | - | 0.8 | 0.2 | ||||||
| All-in Sustaining Costs on a by-product basis (including taxes) | 159.6 | 145.2 | 110.5 | 110.2 | 39.7 | 24.3 | ||||||
| Ounces sold (000) | 196.5 | 132.4 | 150.3 | 116.9 | 46.2 | 15.5 | ||||||
| Adjusted Operating Costs - $ /oz sold | 423 | 446 | 375 | 413 | 580 | 702 | ||||||
| Gold - All-in Sustaining Costs on a by-product basis - $ /oz sold | 669 | 932 | 553 | 758 | 842 | 1,554 | ||||||
| Gold - All-in Sustaining Costs on a by-product basis (including taxes) - $ /oz sold | 813 | 1,097 | 735 | 943 | 860 | 1,565 | ||||||
| Gold - All-in Sustaining Costs on a co-product basis (before taxes) - $ /oz sold | 696 | 903 | 553 | 758 | 958 | 1,303 | ||||||
| Copper - All-in Sustaining Costs on a co-product basis (before taxes) - $ /pound sold | 2.06 | 3.08 | n/a | n/a | 2.06 | 3.08 | ||||||
| (1) Results may not add due to rounding | ||||||||||||
Adjusted earnings can be reconciled as follows:
Adjusted earnings is intended to provide investors with information about the Company’s continuing income generating capabilities. Hence, this measure adjusts for the earnings impact of non-recurring items.
| Three months ended March 31, | |||||
| ($ millions, except as noted) | 2019 | 2018 | |||
| Net earnings (loss) | $ | 50.4 | $ | 9.0 | |
| Adjust for non-recurring items: | |||||
| AuRico Metals Inc. acquisition and integration expenses | - | 4.4 | |||
| Adjusted net earnings | $ | 50.4 | $ | 13.4 | |
| Net earnings (loss) per share - basic | $ | 0.17 | $ | 0.03 | |
| Net earnings (loss) per share - diluted | $ | 0.17 | $ | 0.03 | |
| Adjusted net earnings per share - basic | $ | 0.17 | $ | 0.05 | |
| Adjusted net earnings per share - diluted | $ | 0.17 | $ | 0.05 | |
Free cash flow (unlevered) is calculated as follows:
| Three months ended March 31, | ||||||
| ($ millions, except as noted) | 2019 |
2018 |
||||
| Cash provided by (used in) operations (1) | $ | 118.8 | $ | (39.7 | ) | |
| Adjust for: | ||||||
| Additions to property, plant and equipment (1) | (61.8 | ) | (62.0 | ) | ||
| Free cash flow (deficit) | $ | 57.0 | $ | (101.7 | ) | |
(1) as presented in the Company's Consolidated Statements of Cash Flows.
| Sustaining capital, growth capital and capitalized stripping presented in the All-in Sustaining cost measures can be reconciled as follows: | ||||||||
| Three months ended March 31, | Kumtor | Mount Milligan |
Turkey | All other | Consolidated | |||
| ($ millions) (Unaudited) | ||||||||
| 2019 | ||||||||
| Capitalized stripping –cash | 17.4 | - | - | - | 17.4 | |||
| Sustaining capital - cash | 8.9 | 10.7 | - | - | 19.6 | |||
| Growth capital - cash | 2.0 | - | - | - | 2.0 | |||
| Greenstone Gold Property pre-development capital cash | - | - | - | 3.6 | 3.6 | |||
| Kemess Property pre-development capital cash | - | 4.6 | 4.6 | |||||
| Öksüt project development capital - cash | - | - | 14.9 | - | 14.9 | |||
| Molybdenum business capital - cash | - | - | - | 0.2 | 0.2 | |||
| Prepayment for capital | 0.8 | - | - | - | 0.8 | |||
| Adjustment for changes in accruals and other non-cash items included in additions to PP&E | (0.7 | ) | 2.1 | (2.9 | ) | - | (1.5 | ) |
| Greenstone Gold Property translation adjustment | - | - | - | 0.2 | 0.2 | |||
| Total - Additions to PP&E (1) | 28.4 | 12.8 | 12.0 | 8.6 | 61.8 | |||
| 2018 | ||||||||
| ($ millions) (Unaudited) | ||||||||
| Capitalized stripping –cash | 28.7 | - | - | - | 28.7 | |||
| Sustaining capital - cash | 9.1 | 9.4 | - | - | 18.5 | |||
| Growth capital - cash | 3.4 | - | - | - | 3.4 | |||
| Greenstone Gold Property pre-development capital cash | - | - | - | 1.7 | 1.7 | |||
| Kemess Property pre-development capital cash | - | - | - | 0.2 | 0.2 | |||
| Öksüt project development capital - cash | - | - | 5.1 | - | 5.1 | |||
| Molybdenum business capital - cash | - | - | - | 0.2 | 0.2 | |||
| Prepayment for capital | 0.8 | 1.2 | 1.1 | - | 3.1 | |||
| Adjustment for changes in accruals and other non-cash items included in additions to PP&E | 0.2 | 0.1 | - | 0.3 | 0.6 | |||
| Greenstone Gold Property translation adjustment | - | - | - | 0.5 | 0.5 | |||
| Total - Additions to PP&E (1) | 42.2 | 10.7 | 6.2 | 2.9 | 62.0 | |||
| (1) as presented in the Company's Consolidated Statements of Cash Flows | ||||||||
| Reconciliation of Cash Provided by Operations Before Changes in Working Capital: | |||||||||||
| ($ millions) | Three months ended March 31, 2019 | ||||||||||
| Kumtor | Mount Milligan | Molybdenum | Other | Consolidated | |||||||
| Cash provided by (used in) operations | 120.0 | 12.4 | (0.6 | ) | (13.0 | ) | 118.8 | ||||
| Add back (deduct): | |||||||||||
| Change in operating working capital | (10.1 | ) | 4.2 | (2.1 | ) | 3.5 | (4.5 | ) | |||
| Net cash provided by (used in) operations before changes in working capital | 109.9 | 16.6 | (2.7 | ) | (9.5 | ) | 114.3 | ||||
| Three months ended March 31, 2018 | |||||||||||
| Kumtor | Mount Milligan | Molybdenum | Other | Consolidated | |||||||
| Cash provided by (used in) operations | 43.1 | (42.4 | ) | (9.2 | ) | (31.2 | ) | (39.7 | ) | ||
| Add back (deduct): | |||||||||||
| Change in operating working capital | 41.6 | 35.7 | 13.4 | 15.6 | 106.3 | ||||||
| Net cash provided by (used in) operations before changes in working capital | 84.6 | (6.7 | ) | 4.3 | (15.6 | ) | 66.6 | ||||
Average realized sales price for gold
The average realized gold price per ounce sold is calculated by dividing gold sales revenue, gross together with the final pricing adjustments and mark-to-market adjustments by the ounces sold, as shown in the table below:
| Average realized sales price for gold | Three months ended March 31, | |||
| 2019 | 2018 | |||
| Gold sales reconciliation ($ millions) | ||||
| Gold sales - Kumtor | 195.0 | 153.0 | ||
| Gold sales - Mt. Milligan | ||||
| Gold sales related to cash portion of Royal Gold stream | 6.9 | 2.3 | ||
| Mark-to-market adjustments on sales to Royal Gold | 0.1 | (0.1 | ) | |
| Final adjustments on sales to Royal Gold | (0.6 | ) | 0.2 | |
| Total gold sales under Royal Gold stream | 6.4 | 2.4 | ||
| Gold sales to third party customers | 38.9 | 12.4 | ||
| Mark-to-market adjustments | (0.5 | ) | - | |
| Final pricing adjustments | 1.1 | 1.3 | ||
| Final metal adjustments | 0.7 | - | ||
| Total gold sales to third party customers | 40.2 | 13.7 | ||
| Gold sales, net of adjustments | 46.6 | 16.1 | ||
| Refining and treatment costs | (0.2 | ) | (0.1 | ) |
| Total gold sales | 46.4 | 16.0 | ||
| Total gold revenue - Consolidated | 241.4 | 169.0 | ||
| Ounces of gold sold | ||||
| Gold ounces sold - Kumtor | 150,267 | 116,919 | ||
| Ounces sold to Royal Gold - Mt. Milligan | 16,014 | 5,374 | ||
| Ounces sold to third party customers - Mt. Milligan | 30,170 | 10,139 | ||
| Total ounces sold - Consolidated | 196,451 | 132,432 | ||
| Average realized sales price for gold on a per ounce basis | ||||
| Average realized sales price - Kumtor | 1,297 | 1,309 | ||
| Average realized gold price - Royal Gold | 435 | 435 | ||
| Average realized gold price - Mark-to-market adjustments | 4 | (18 | ) | |
| Average realized gold price - Final pricing adjustments | (36 | ) | 39 | |
| Average realized gold price - Mt. Milligan - Royal Gold | 403 | 456 | ||
| Average realized gold price - Third party | 1,289 | 1,221 | ||
| Average realized gold price - Mark-to-market adjustments | (17 | ) | 4 | |
| Average realized gold price - Final pricing adjustments | 36 | 124 | ||
| Average realized gold price - Final metal adjustments | 25 | - | ||
| Average realized gold price - Mt. Milligan - Third party | 1,333 | 1,349 | ||
| Average realized gold price - Mt. Milligan - Combined | 1,003 | 1,031 | ||
| Average realized sales price for gold - Consolidated | 1,229 | 1,277 | ||
Average realized sales price for Copper - Mount Milligan
The average realized copper price per pound is calculated by dividing copper sales revenue, gross together with the final pricing adjustments and mark-to-market adjustments per pound, as shown in the table below:
| Average realized sales price for Copper - Mount Milligan | Three months ended March 31, | |||
| 2019 | 2018 | |||
| Copper sales reconciliation ($ millions) | ||||
| Copper sales related to cash portion of Royal Gold stream | 1.0 | 0.4 | ||
| Mark-to-market adjustments on Royal Gold stream | (0.3 | ) | 0.2 | |
| Final adjustments on sales to Royal Gold | (0.6 | ) | 0.2 | |
| Total copper sales under Royal Gold stream | 0.2 | 0.9 | ||
| Copper sales to third party customers | 29.1 | 11.2 | ||
| Mark-to-market adjustments | 1.5 | (0.9 | ) | |
| Final pricing adjustments | 4.3 | 0.1 | ||
| Final metal adjustments | (0.6 | ) | (0.2 | ) |
| Total copper sales to third party customers | 34.3 | 10.2 | ||
| Copper sales, net of adjustments | 34.5 | 11.1 | ||
| Refining and treatment costs | (3.4 | ) | (1.1 | ) |
| Copper sales | 31.1 | 10.0 | ||
| Pounds of copper sold (000's lbs) | ||||
| Pounds sold to Royal Gold | 2,356 | 805 | ||
| Pounds sold to third party customers | 10,166 | 3,701 | ||
| Total pounds sold | 12,522 | 4,506 | ||
| Average realized sales price for copper on a per pound basis | ||||
| Copper sales related to cash portion of Royal Gold stream | 0.42 | 0.50 | ||
| Mark-to-market adjustments on Royal Gold stream | (0.11 | ) | 0.29 | |
| Final pricing adjustments on Royal Gold stream | (0.26 | ) | 0.26 | |
| Average realized copper price - Royal Gold | 0.05 | 1.05 | ||
| Average realized copper price - Third party | 2.87 | 3.02 | ||
| Average realized copper price - Mark-to-market adjustments | 0.15 | (0.24 | ) | |
| Average realized copper price - Final pricing adjustments | 0.42 | 0.03 | ||
| Average realized copper price - Metal pricing adjustments | (0.06 | ) | (0.04 | ) |
| Average realized copper price - Third party | 3.38 | 2.77 | ||
| Average realized copper price - Combined | 2.49 | 2.22 | ||
Caution Regarding Forward-Looking Information
Information contained in this document which are not statements of historical facts, and the documents incorporated by reference herein, may be “forward-looking information” for the purposes of Canadian securities laws. Such forward-looking information involves risks, uncertainties and other factors that could cause actual results, performance, prospects and opportunities to differ materially from those expressed or implied by such forward looking information. The words “believe”, “expect”, “anticipate”, “contemplate”, “plan”, “intends”, “continue”, “budget”, “estimate”, “may”, “will”, “schedule”, “understand” and similar expressions identify forward-looking information. These forward-looking statements relate to, among other things: the Company’s expectations regarding the level of water capture at Mount Milligan and mill throughput levels for 2019; timing for first gold pour at the Öksüt project; our planned exploration activities for the remainder of 2019; the Company’s expectations regarding applying for an extension of the Öksüt mining license; expectations regarding a long-term water strategy for Mount Milligan; planned activities for 2019 at the Kemess Underground Project; the completion of the Kumtor Strategic Agreement, including the successful resolution of outstanding claims and investigations impacting the Kumtor Project and its current and former employees; expectations regarding updating the technical studies and environmental studies for the Endako Mine and the possible increase in its asset retirement obligation; statements made under the heading “2019 Outlook” including forecast 2019 production figures and costs, capital and exploration expenditures and taxes.
Forward-looking information is necessarily based upon a number of estimates and assumptions that, while considered reasonable by Centerra, are inherently subject to significant political, business, economic and competitive uncertainties and contingencies. Known and unknown factors could cause actual results to differ materially from those projected in the forward looking information. Factors that could cause actual results or events to differ materially from current expectations include, among other things: (A) strategic, legal, planning and other risks, including: political risks associated with the Company’s operations in the Kyrgyz Republic and Canada; risks that any of the conditions precedent to the Strategic Agreement will not be satisfied in a timely manner or at all, particularly as the Government may not bind the General Prosecutor’s Office or the Parliament of the Kyrgyz Republic; a decision by the General Prosecutor’s Office, or its successor the Anti-Corruption Service of the State Committee for National Security, to re-open at any time civil or criminal proceedings against Centerra, its subsidiaries or other stakeholders; the failure of the Government to comply with its continuing obligations under the Strategic Agreement, including the requirement that it comply at all times with its obligations under the Kumtor Project Agreements, allow for the continued operation of the Kumtor Mine by KGC and KOC and not take any expropriatory action; actions by the Government or any state agency or the General Prosecutor's Office that serve to restrict or otherwise interfere with the payment of funds by KGC and KOC to Centerra; resource nationalism including the management of external stakeholder expectations; the impact of changes in, or to the more aggressive enforcement of, laws, regulations and government practices, including with respect to the environment, in the jurisdictions in which the Company operates including any delays or refusals to grant required permits and licenses, unjustified civil or criminal action against the Company, its affiliates or its current or former employees; risks that community activism may result in increased contributory demands or business interruptions; the impact of any actions taken by the Kyrgyz Republic Government and Parliament relating to the Kumtor Project Agreements which are inconsistent with the rights of Centerra and KGC under the Kumtor Project Agreements; any impact on the purported cancellation of Kumtor’s land use rights at the Kumtor Project; the risks related to other outstanding litigation affecting the Company’s operations in the Kyrgyz Republic and elsewhere; the impact of the delay by relevant government agencies to provide required approvals, expertises and permits; potential impact on the Kumtor Project of investigations by Kyrgyz Republic instrumentalities; the impact of constitutional changes in Turkey; the impact of any sanctions imposed by Canada, the United States or other jurisdictions against various Russian individuals and entities; potential defects of title in the Company’s properties that are not known as of the date hereof; the inability of the Company and its subsidiaries to enforce their legal rights in certain circumstances; the presence of a significant shareholder that is a state-owned company of the Kyrgyz Republic; risks related to anti-corruption legislation; risks related to the concentration of assets in Central Asia; Centerra’s future exploration and development activities not being successful; Centerra not being able to replace mineral reserves; Indigenous claims and consultative issues relating to the Company’s properties which are in proximity to Indigenous communities; and potential risks related to kidnapping or acts of terrorism; (B) risks relating to financial matters, including: sensitivity of the Company’s business to the volatility of gold, copper and other mineral prices, the use of provisionally-priced sales contracts for production at Mount Milligan, reliance on a few key customers for the gold-copper concentrate at Mount Milligan, use of commodity derivatives, the imprecision of the Company’s mineral reserves and resources estimates and the assumptions they rely on, the accuracy of the Company’s production and cost estimates, the impact of restrictive covenants in the Company’s credit facilities which may, among other things, restrict the Company from pursuing certain business activities or making distributions from its subsidiaries, the Company’s ability to obtain future financing, the impact of global financial conditions, the impact of currency fluctuations, the effect of market conditions on the Company’s short-term investments, the Company’s ability to make payments including any payments of principal and interest on the Company’s debt facilities depends on the cash flow of its subsidiaries; and (C) risks related to operational matters and geotechnical issues and the Company’s continued ability to successfully manage such matters, including the movement of the Davidov Glacier, waste and ice movement and continued performance of the buttress at the Kumtor Project; the occurrence of further ground movements at the Kumtor Project and mechanical availability; the risk of having sufficient water to continue operations at Mount Milligan and achieve expected mill throughput; the success of the Company’s future exploration and development activities, including the financial and political risks inherent in carrying out exploration activities; inherent risks associated with the use of sodium cyanide in the mining operations; the adequacy of the Company’s insurance to mitigate operational risks; mechanical breakdowns; the Company’s ability to replace its mineral reserves; the occurrence of any labour unrest or disturbance and the ability of the Company to successfully re-negotiate collective agreements when required; the risk that Centerra’s workforce may be exposed to widespread epidemic; seismic activity in the vicinity of the Company’s properties; long lead times required for equipment and supplies given the remote location of some of the Company’s operating properties; reliance on a limited number of suppliers for certain consumables, equipment and components; the Company’s ability to accurately predict decommissioning and reclamation costs; the Company’s ability to attract and retain qualified personnel; competition for mineral acquisition opportunities; and risks associated with the conduct of joint ventures/partnerships; the Company’s ability to manage its projects effectively and to mitigate the potential lack of availability of contractors, budget and timing overruns and project resources. See section titled “Risks that can affect our business” in the Company’s most recently filed Annual Information Form available on SEDAR at www.sedar.com.
Furthermore, market price fluctuations in gold and copper, as well as increased capital or production costs or reduced recovery rates may render ore reserves containing lower grades of mineralization uneconomic and may ultimately result in a restatement of reserves. The extent to which resources may ultimately be reclassified as proven or probable reserves is dependent upon the demonstration of their profitable recovery. Economic and technological factors which may change over time always influence the evaluation of reserves or resources. Centerra has not adjusted mineral resource figures in consideration of these risks and, therefore, Centerra can give no assurances that any mineral resource estimate will ultimately be reclassified as proven and probable reserves.
Mineral resources are not mineral reserves, and do not have demonstrated economic viability, but do have reasonable prospects for economic extraction. Measured and indicated resources are sufficiently well defined to allow geological and grade continuity to be reasonably assumed and permit the application of technical and economic parameters in assessing the economic viability of the resource. Inferred resources are estimated on limited information not sufficient to verify geological and grade continuity or to allow technical and economic parameters to be applied. Inferred resources are too speculative geologically to have economic considerations applied to them to enable them to be categorized as mineral reserves. There is no certainty that mineral resources of any category can be upgraded to mineral reserves through continued exploration.
There can be no assurances that forward-looking information and statements will prove to be accurate, as many factors and future events, both known and unknown could cause actual results, performance or achievements to vary or differ materially, from the results, performance or achievements that are or may be expressed or implied by such forward-looking statements contained herein or incorporated by reference. Accordingly, all such factors should be considered carefully when making decisions with respect to Centerra, and prospective investors should not place undue reliance on forward looking information. Forward-looking information is as of May 1, 2019. Centerra assumes no obligation to update or revise forward looking information to reflect changes in assumptions, changes in circumstances or any other events affecting such forward-looking information, except as required by applicable law.
| Centerra Gold Inc. | ||||||||||
| Condensed Consolidated Interim Statements of Financial Position | ||||||||||
| (Unaudited) | March 31, | December 31, | ||||||||
|
2019 |
2018 |
|||||||||
| (Expressed in thousands of United States Dollars) | ||||||||||
| Assets | ||||||||||
| Current assets | ||||||||||
| Cash and cash equivalents | $ | 180,421 | $ | 151,705 | ||||||
| Amounts receivable | 64,482 | 59,558 | ||||||||
| Inventories | 587,164 | 596,911 | ||||||||
| Prepaid expenses and other current assets | 20,017 | 24,734 | ||||||||
| Current portion of derivative assets | 594 | 1,081 | ||||||||
| 852,678 | 833,989 | |||||||||
| Property, plant and equipment | 1,926,282 | 1,886,046 | ||||||||
| Goodwill | 16,070 | 16,070 | ||||||||
| Restricted cash | 27,489 | 27,505 | ||||||||
| Reclamation deposits | 35,631 | 30,841 | ||||||||
| Other assets | 31,134 | 32,260 | ||||||||
| 2,036,606 | 1,992,722 | |||||||||
| Total assets | $ | 2,889,284 | $ | 2,826,711 | ||||||
| Liabilities and Shareholders' equity | ||||||||||
| Current liabilities | ||||||||||
| Accounts payable and accrued liabilities | $ | 168,278 | $ | 173,783 | ||||||
| Provision for Kyrgyz Republic settlement | 53,000 | 53,000 | ||||||||
| Short-term debt | 26,986 | 5,000 | ||||||||
| Current portion of lease obligations | 5,535 | 797 | ||||||||
| Revenue-based taxes payable | 15,358 | 954 | ||||||||
| Taxes payable | 1,360 | 878 | ||||||||
| Current portion of provision for reclamation | 2,579 | 197 | ||||||||
| Current portion of derivative liabilities | 130 | 101 | ||||||||
| Other current liabilities | 41 | 67 | ||||||||
| 273,267 | 234,777 | |||||||||
| Long-term debt | 136,249 | 179,266 | ||||||||
| Provision for reclamation | 212,294 | 212,248 | ||||||||
| Lease obligations | 20,559 | 4,229 | ||||||||
| Deferred income tax liability | 41,555 | 44,524 | ||||||||
| Other liabilities | 3,699 | 3,636 | ||||||||
| 414,356 | 443,903 | |||||||||
| Shareholders' equity | ||||||||||
| Share capital | 952,130 | 949,328 | ||||||||
| Contributed surplus | 27,155 | 27,364 | ||||||||
| Accumulated other comprehensive loss | (1,488 | ) | (2,088 | ) | ||||||
| Retained earnings | 1,223,864 | 1,173,427 | ||||||||
| 2,201,661 | 2,148,031 | |||||||||
| Total liabilities and Shareholders' equity | $ | 2,889,284 | $ | 2,826,711 | ||||||
| Centerra Gold Inc. | ||||||||||
| Condensed Consolidated Interim Statements of Earnings and Comprehensive Income | ||||||||||
| (Unaudited) | Three months ended March 31, |
|||||||||
| 2019 | 2018 | |||||||||
| (Expressed in thousands of United States Dollars) | ||||||||||
| (except per share amounts) | ||||||||||
| Gold sales | $ | 241,313 | $ | 169,090 | ||||||
| Copper sales | 31,135 | 10,012 | ||||||||
| Molybdenum sales | 58,642 | 54,121 | ||||||||
| Tolling, calcining and other | 2,950 | 2,176 | ||||||||
| Revenue | 334,040 | 235,399 | ||||||||
| Cost of sales | 223,308 | 152,815 | ||||||||
| Standby costs | - | 10,849 | ||||||||
| Regional office administration | 2,898 | 2,802 | ||||||||
| Earnings from mine operations | 107,834 | 68,933 | ||||||||
| Revenue-based taxes | 27,394 | 21,556 | ||||||||
| Other operating expenses | 2,968 | 3,555 | ||||||||
| Care and maintenance expense | 7,323 | 3,923 | ||||||||
| Pre-development project costs | 3,283 | 2,168 | ||||||||
| Exploration expenses and business development | 5,003 | 2,361 | ||||||||
| Business combination acquisition and integration expenses | - | 4,413 | ||||||||
| Corporate administration | 9,699 | 10,435 | ||||||||
| Earnings from operations | 52,164 | 20,522 | ||||||||
| Other income, net | (141 | ) | (5,403 | ) | ||||||
| Finance costs | 3,982 | 14,657 | ||||||||
| Earnings before income tax | 48,323 | 11,268 | ||||||||
| Income tax (recovery) expense | (2,114 | ) | 187 | |||||||
| Net earnings from continuing operations | $ | 50,437 | $ | 11,081 | ||||||
| Net loss from discontinued operations | - | (2,036 | ) | |||||||
| Net earnings | $ | 50,437 | $ | 9,045 | ||||||
| Other Comprehensive Income | ||||||||||
| Items that may be subsequently reclassified to earnings: | ||||||||||
| Net gain (loss) on translation of foreign operation | 797 | (1,039 | ) | |||||||
| Net unrealized (loss) gain on derivative instruments, net of tax | (197 | ) | 7,385 | |||||||
| Other comprehensive income | 600 | 6,346 | ||||||||
| Total comprehensive income | $ | 51,037 | $ | 15,391 | ||||||
| Basic earnings per share - Continuing operations | $ | 0.17 | $ | 0.04 | ||||||
| Diluted earnings per share - Continuing operations | $ | 0.17 | $ | 0.04 | ||||||
| Basic earnings per share | $ | 0.17 | $ | 0.03 | ||||||
| Diluted earnings per share | $ | 0.17 | $ | 0.03 | ||||||
| Centerra Gold Inc. | Three months ended March 31, |
|||||||||
| Condensed Consolidated Interim Statements of Cash Flows | ||||||||||
| (Unaudited) | 2019 | 2018 | ||||||||
| (Expressed in thousands of United States Dollars) | ||||||||||
| Operating activities | ||||||||||
| Net earnings from continuing operations | $ | 50,437 | $ | 11,081 | ||||||
| Adjustments for the following items: | ||||||||||
| Depreciation, depletion and amortization | 55,735 | 42,264 | ||||||||
| Finance costs | 3,982 | 14,657 | ||||||||
| Compensation expense on stock options | 607 | 243 | ||||||||
| Other share-based compensation expense | 6,093 | 2,707 | ||||||||
| Income tax (recovery) expense | (2,114 | ) | 187 | |||||||
| Reclamation expense (recovery) | 436 | (671 | ) | |||||||
| Other | (313 | ) | 2,640 | |||||||
| 114,863 | 73,108 | |||||||||
| Change in operating working capital | 4,546 | (106,070 | ) | |||||||
| Purchase and settlement of derivatives | 171 | (2,189 | ) | |||||||
| Income taxes paid | (827 | ) | (1,735 | ) | ||||||
| Cash provided by (used in) continuing operations | 118,753 | (36,886 | ) | |||||||
| Cash used in discontinued operations | - | (2,844 | ) | |||||||
| Net cash provided by (used in) operations | 118,753 | (39,730 | ) | |||||||
| Investing activities | ||||||||||
| Additions to property, plant and equipment | (60,940 | ) | (58,985 | ) | ||||||
| Prepayment for property, plant and equipment | (821 | ) | (2,997 | ) | ||||||
| Acquisition of AuRico Metals Inc., net of cash acquired | - | (226,800 | ) | |||||||
| Decrease (increase) in restricted cash | 16 | (2,323 | ) | |||||||
| Increase in reclamation deposits and other assets | (4,707 | ) | (4,339 | ) | ||||||
| Proceeds from disposition of fixed assets | - | 1,145 | ||||||||
| Cash used in investing from continuing operations | (66,452 | ) | (294,299 | ) | ||||||
| Cash provided by investing from discontinued operations | - | 194 | ||||||||
| Net cash used in investing | (66,452 | ) | (294,105 | ) | ||||||
| Financing activities | ||||||||||
| Debt drawdown | 54,820 | 49,070 | ||||||||
| Debt repayment | (76,000 | ) | - | |||||||
| Payment of interest and borrowing costs | (2,949 | ) | (10,695 | ) | ||||||
| Lease payments | (1,401 | ) | ||||||||
| Proceeds from common shares issued | 1,945 | - | ||||||||
| Cash (used in) provided by financing | (23,585 | ) | 38,375 | |||||||
| Increase (decrease) in cash during the period | 28,716 | (295,460 | ) | |||||||
| Cash and cash equivalents at beginning of the period | 151,705 | 415,891 | ||||||||
| Cash and cash equivalents at end of the period | $ | 180,421 | $ | 120,431 | ||||||
| Cash and cash equivalents consist of: | ||||||||||
| Cash | $ | 180,421 | $ | 77,378 | ||||||
| Cash equivalents | - | 43,053 | ||||||||
| $ | 180,421 | $ | 120,431 | |||||||
| Refer to the notes that accompany the Company’s unaudited condensed consolidated interim financial statements that are filed on SEDAR, as these form an integral part of these financial statements. | ||||||||||
The Unaudited Interim Consolidated Financial Statements and Notes for the three months ended March 31, 2019 and Management’s Discussion and Analysis for the three months ended March 31, 2019 have been filed on the System for Electronic Document Analysis and Retrieval (‘SEDAR’) at www.sedar.com and are available at the Company’s web site at: www.centerragold.com.
About Centerra
Centerra Gold Inc. is a Canadian-based gold mining company primarily focused on operating, developing, exploring and acquiring gold and copper properties in North America, Asia and other markets worldwide. Centerra operates two flagship assets, the Kumtor Mine in the Kyrgyz Republic and the Mount Milligan Mine in British Columbia, Canada and is the largest Western-based gold producer in Central Asia. Centerra's shares trade on the Toronto Stock Exchange (TSX) under the symbol CG. The Company is based in Toronto, Ontario, Canada.
Conference Call
Centerra invites you to join its 2019 first quarter conference call on Wednesday, May 1, 2019 at 8:30AM Eastern Time. The call is open to all investors and the media. To join the call, please dial Toll-Free in North America +1 (800) 618-4714. International participants can call: +1 (303) 223-4371. Results summary slides are available on Centerra Gold’s website at www.centerragold.com. Alternatively, an audio feed web cast will be broadcast live by Nasdaq and can be accessed at Centerra Gold’s website at www.centerragold.com. A recording of the call will be available on www.centerragold.com shortly after the call and via telephone until midnight Eastern Time on Monday, May 8, 2019 by calling (416) 626-4100 or (800) 558-5253 and using passcode 21919769.
For more information:
John W. Pearson
Vice President, Investor Relations
Centerra Gold Inc.
(416) 204-1953
john.pearson@centerragold.com
Additional information on Centerra is available on the Company’s web site at www.centerragold.com and at SEDAR at www.sedar.com.
An attachment is available at the following link:
http://ml.globenewswire.com/Resource/Download/7a0d1a96-6b71-438b-9da3-74c23d457579

Distribution channels: Banking, Finance & Investment Industry, Mining Industry
Legal Disclaimer:
EIN Presswire provides this news content "as is" without warranty of any kind. We do not accept any responsibility or liability for the accuracy, content, images, videos, licenses, completeness, legality, or reliability of the information contained in this article. If you have any complaints or copyright issues related to this article, kindly contact the author above.
Submit your press release